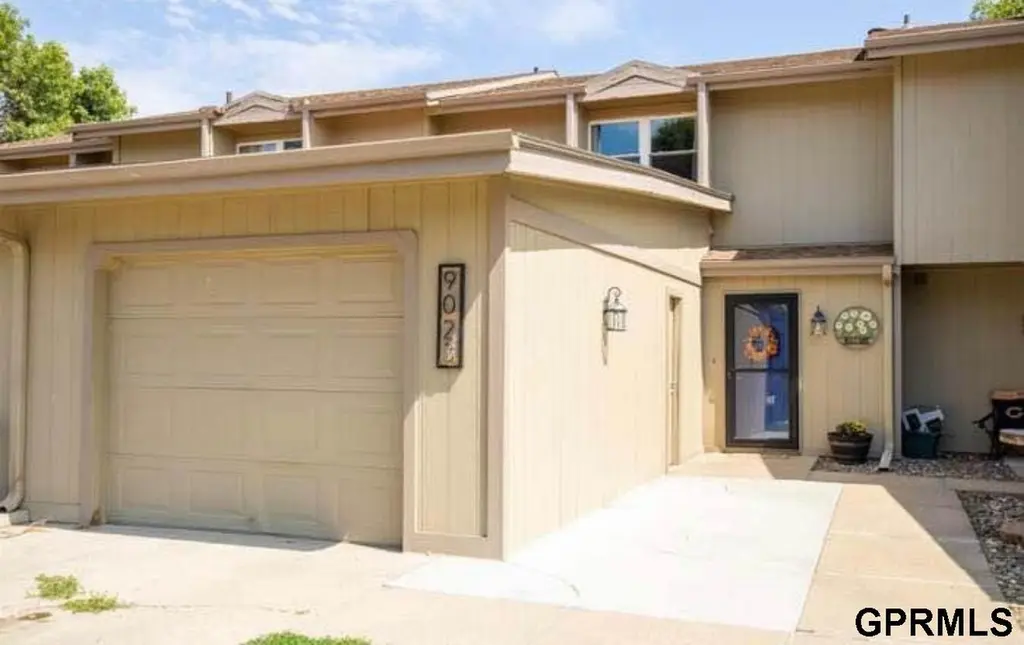
9023 Gary Cir · Chalco, NE
Flood risk 1/10 · Minimal
- FEMA flood zone
- X (unshaded)
- Chance of flooding over 30 yrs
- 0.0%
- Est. flood insurance / yr
- $507 – $1,088
Fire risk 1/10 · Minimal
- Est. fire insurance / yr
- $1,161 – $2,155
Heat risk 3/10 · Minor
- Hot days now (above 103°F)
- 7 days/yr
- Hot days in 30 yrs
- 16 days/yr
Wind risk 2/10 · Minimal
- Chance of severe wind over 30 yrs
- —
Air-quality risk 2/10 · Minimal
- Unhealthy air days now
- 1 days/yr
- Unhealthy air days in 30 yrs
- 1 days/yr
Risk factors via First Street. Map © Google.
Why this score? — see what drove the D- grade
The composite is a weighted blend of 9 inputs, each scored 0–100. Each bar is that input's sub-score; the figure is the points it added to the 100-point composite (weight × sub-score).
- Cash flow +11.4/30.0
- ARV discount +6.6/15.0
- Schools +5.3/10.0
- Livability +4.0/5.0
- DSCR +3.4/10.0
- Rent growth +3.4/5.0
- 1% rule +3.3/10.0
- Condition / age +2.5/5.0
- Appreciation +0.0/10.0
$245,000
🖨 Deal sheet 📄 Offer letter ✓ Due diligence
Listing remarks MLS
Come see this maintenance free Millard home including a re-modeled Kitchen, re-modeled bathroom, and new HVAC as well! Water, trash, lawn care, and exterior maintenance are covered by the HOA! Conveniently located off the interstate in a wonderful school district, this home boasts a tandem 1 car garage, spacious bedrooms, and a wood burning fireplace to keep you warm during the long winter months. Also enjoy a swimming pool within walking distance as well as as short drive to Nebraska Outlets in Gretna. Don't hesitate to make your appointment today!
Key facts
- Common area
- Private cul-de-sac
- Walking trails
Tags
Property features AI
Finance
- HOA & community: Homeowners association with $157 annual fee; HOA covers grounds maintenance, pool access and maintenance, clubhouse, snow removal, common area maintenance, and playground
Exterior
- Parking: Attached garage (1 covered space, total 1 parking space)
- Utilities: Cable available; Public water; Public sewer
- Home design: Townhouse; Two levels; Residential property; Not new / not a model
- Construction: Masonite exterior; Composition roof; Slab foundation; Built in 1975
- Exterior features: Porch; Patio; Sprinkler system; Zero-step entry; Full wood fencing
Interior
- Kitchen: Range; Refrigerator; Freezer; Dishwasher; Microwave
- Bedrooms: Master bedroom on 2nd floor; Bedroom 2 on 2nd floor; Bedroom 3 on 2nd floor
- Flooring: Carpet; Luxury vinyl plank
- Bathrooms: One full bathroom; One half bathroom; Main level bathroom available
- Heating & cooling: Electric forced-air heating; Central air conditioning
- Interior features: High ceilings; Two-story entry; Ceiling fan(s); One fireplace
Neighborhood map
What this means for you Summary
Snapshot
- This is a 3-bed/2.0-bath townhouse listed at $245k.
Deal economics
- At list price, monthly cash flow is $-83 ($-997/yr) — negative.
- To cash-flow at today's rent, offer at most $230k (6.0% below list).
- To meet the 1% rule (rent ≥ 1% of price), the offer needs to be $203k (17.3% below list).
- Recommended offer: $203k (17.3% below list) — sets the bar for 1% rule.
- Cap rate 5.9% vs local median 4.4% in Chalco — top-decile yield for the area; either an underpriced asset or a hidden risk that comps aren't pricing in. Stress-test before assuming the spread holds.
Location & tenants
- Location reads 79/100 on livability (#46 in NE, #2,335 nationally) — a middle-class / working-renter tenant base. Strengths: employment A+, cost of living A+, housing A+; Watch: amenities F, commute F.
- Millard Public Schools (urban): math 58% / reading 60% proficiency, ranked #13 of 111 in NE (top 12%) — acceptable for families but not a draw, mixed tenant base, ~2y average lease; only 13% free/reduced lunch — higher-income household profile.
- Zoned schools: Norris Elementary School (math 42% / reading 52%, grade D-, #266 of 502 statewide, top 56%, 431 students, 48% FRL); Millard Central Middle School (math 39% / reading 41%, grade F, #84 of 128 statewide, top 65%, 825 students, 47% FRL); Millard South High School (math 51% / reading 54%, grade C-, #97 of 261 statewide, top 37%, 2,607 students, 36% FRL) — zoned schools average 44% FRL vs 13% district-wide (30 pts higher); higher-poverty schools than district average — tighter screening recommended.
- Zoned-school proficiency averages 46% at this address vs 59% district-wide (-12 pts) — the specific schools serving this property underperform the Millard Public Schools average; the district grade overstates school quality for this exact location.
- Market conditions: Rents rising (+3.7%/yr); 71 active listings in the ZIP; 11 comparable units currently listed for rent nearby; rentals leasing fast (median 3d on market — plan ~1-2 weeks tenant-placement turnaround); solid renter incomes; 1,612 units permitted in Sarpy County in 2024 (364 in 5+ unit buildings).
Forward outlook
- Local home prices are declining (-3.0%/yr); year-one equity from $2k of loan paydown is wiped out by about $7k of value loss. Plan a longer hold.
- Sarpy County population projected at +41% by 2050 — long-run rental-demand tailwind backs the buy-and-hold thesis.
Negotiation context
- Only 14 days on market — expect competitive offers; lowballing is unlikely to land.
- 5 sale attempts since 17y ago with the ask held roughly flat each time — persistent listings suggest the price (not the market) is what's stuck; bring a comps-based counter.
- Current owner paid $170k; 44% above their basis — modest negotiation headroom, anchor on the comps not their cost.
Questions for the listing agent
- What do current leases actually rent for vs. the listed asking? Can we see a recent rent roll and the last 12 months of T-12 income?
- Built in 1975 — when were the roof, HVAC, electrical panel, plumbing, and water heater last replaced?
- What does the HOA fee cover, when was the last increase, and are there any pending special assessments or reserve-fund shortfalls?
- Is there a deadline driving the sale (1031 exchange, divorce, estate, relocation)? That informs how much negotiation room exists.
- The area grade is low — what's the realistic commute time and amenity access for the typical tenant pool here? Any planned neighborhood developments (good or bad) we should know about?
- What's the average days-on-market for RENTAL listings here right now (not sales)? A rising rental-DOM trend means longer vacancies and softer asking-rent achievability than the comps imply.
- What's the recent tenant-quality profile in this submarket — average credit score on applications, eviction rate, late-payment / NSF rate, and stable-employment percentage? A property-management company in the area should have these aggregated.
- How much new for-sale + rental construction is in the pipeline within 1–3 miles? Heavy new supply typically softens prices + rents 12–24 months out; constrained supply supports both.
Investment metrics
- 1% rule
- 0.83% ✗
- Cap rate
- 5.89%
- Cash-on-cash
- -1.45%
- DSCR
- 0.94
- GRM
- 10.1
CMA / ARV
- ARV (on-the-fly)
- $240,124
- Comps found
- 4
Show comp detail 4 sales within ~0.75 mi
| Address | Dist | Beds/Ba | Sqft | Sold | Price | $/sf | Match |
|---|---|---|---|---|---|---|---|
| 9012 David Cir | 0.02mi | 3/3.0 | 1,535 (+11%) | 2mo | $265,000 | $173 | 76 |
| 13944 Meadow Ridge Rd | 0.13mi | 3/1.5 | 1,494 (+8%) | 8mo | $260,000 | $174 | 72 |
| 9016 Gary Cir | 0.05mi | 3/1.5 | 1,452 (+5%) | 22mo | $199,000 | $137 | 70 |
| 13801 Meadow Ridge Rd | 0.10mi | 3/1.5 | 1,568 (+13%) | 18mo | $195,000 | $124 | 57 |
Match score weights: distance 35% · size 25% · config 20% · recency 20%. Top-matched comps best support the ARV.
Projected returns pro-forma
-3.0% appreciation · 3.73% rent growth · sell at horizon
- IRR
- -17.9%
- Equity multiple
- 0.37×
- Total profit
- $-43,468
- Equity at exit
- $36,530
- IRR
- -8.7%
- Equity multiple
- 0.44×
- Total profit
- $-38,321
- Equity at exit
- $21,183
Cash invested: $68,600 (down + closing). Projections, not guarantees.
Landlord ↔ Tenant lean methodology
- Overall (STATE)
- 83 Strongly Landlord-Friendly
- State Nebraska
- 83 Strongly Landlord-Friendly · R+13
- County
- — inherits STATE
- City
- — inherits STATE
ZIP-level market 68138
- Home prices YoY
- -19.6%
- Rents YoY
- 3.7%
- Active inventory
- 71
- Price-to-rent
- 10.1×
Monthly cashflow live
- Estimated rent
- $2,026 high interval (Pro) →
- Mortgage (P&I)
- −$1,285
- Tax from tax record
- −$284 /mo · $3,403/yr
- Insurance
- −$102
- HOA
- −$13
- Vacancy / Maint / Mgmt
- −$425
- Net cashflow
- $-83
Break-even live
UW: 25.0% down · 7.5% · 30yr · 1.5% tax · 5.0% vac · 8.0% maint · 8.0% mgmt
Financing live
Cash to close
- Down payment
- $61,250
- Closing costs
- $7,350
- Reserves months
- —
- Total cash needed
- —
Loan-product check · same deal, 3 products live
Conventional
25% down · 7.5% · 30yr
- Down + closing
- —
- Monthly P&I
- —
- Monthly cashflow
- —
- DSCR
- —
- Eligible?
- —
Personal DTI + credit; lowest rate.
DSCR
20% down · 8.5% · 30yr
- Down + closing
- —
- Monthly P&I
- —
- Monthly cashflow
- —
- DSCR
- —
- Eligible?
- —
No personal income docs; deal must DSCR.
Hard money
10% down · 12.0% · 12mo
- Down + closing
- —
- Monthly P&I
- —
- Monthly cashflow
- —
- DSCR
- —
- Eligible?
- —
Short-term bridge; refi at stabilization.
Rent comps 11 comps
| Address | Beds | Baths | Sqft | Rent | $/sqft | DOM | Units | Dist |
|---|---|---|---|---|---|---|---|---|
| 9002 David Cir Omaha, NE | 3.0 | 3.0 | 1534 | $1,950 | $1.27 | 3d | 1 | 0.02mi |
| 13906 Jennifer Rd Omaha, NE | 4.0 | 2.0 | 1611 | $2,200 | $1.37 | 3d | 1 | 0.24mi |
| 8803 S 143rd St Omaha, NE | 3.0 | 1.5 | 1300 | $1,895 | $1.46 | 3d | 1 | 0.32mi |
| 13041 Cornhusker Rd Omaha, NE | 1.0–2.0 | 1.0–2.0 | 1222 | $2,295 | $1.88 | 3d | 13 | 0.92mi |
| 13106 Chandler Road Plz Omaha, NE | 1.0–2.0 | 1.0–2.0 | 912 | $1,589 | $1.74 | 3d | 25 | 1.08mi |
| 7561 S 146th St Omaha, NE | 3.0 | 1.0–2.0 | 1035 | $2,418 | $2.34 | 3d | 12 | 1.11mi |
| 13178 Lincoln Rd Omaha, NE | 2.0–4.0 | 2.0–3.5 | 1770 | $2,245 | $1.27 | 3d | 6 | 1.14mi |
| 13108 Lincoln Rd Omaha, NE | 1.0–4.0 | 1.0–3.5 | 1584 | $2,412 | $1.52 | 3d | 11 | 1.17mi |
| 13530 Josephine St Omaha, NE | 3.0 | 2.0 | 1440 | $2,095 | $1.45 | 14d | 1 | 1.22mi |
| 13616 Emiline Cir Omaha, NE | 3.0 | 1.5 | 1296 | $2,145 | $1.66 | 3d | 1 | 1.42mi |
| 7106 S 145th St Omaha, NE | 4.0 | 3.0 | 1720 | $2,100 | $1.22 | 14d | 1 | 1.44mi |
HOA detail
- Monthly dues
- $13 · $156/yr
- Likely covers
- watertrashlandscapingexterior maint.pool
Listing history 11 events
-
2026-06-18days on market $245,000 Active 14 DOM
-
2026-06-17days on market $245,000 Active 13 DOM
-
2026-06-16days on market $245,000 Active 12 DOM
-
2026-06-15days on market $245,000 Active 11 DOM
-
2026-06-13days on market $245,000 Active 9 DOM
-
2026-06-10days on market $245,000 Active 6 DOM
-
2026-06-09statusdays on market $245,000 Active 5 DOM
-
2026-06-08days on market $245,000 New 4 DOM
-
2026-06-07days on market $245,000 New 3 DOM
-
2026-06-05remarks 699-char remark
-
2026-06-05$245,000 New 1 DOM
ⓘ Source: listings_history table (triggers on properties + properties_extension) + one-shot
backfill from property_details.listing_events for pre-trigger history.
Tax reassessment forecast NE · Resets to sale price
- Current annual tax
- $3,403 · $284/mo
- Projected year-2 tax
- $4,238 · $353/mo
- Expected delta
- +$835/yr (+$70/mo · 24.5%)
ⓘ Screening estimate from a state-policy table — verify with the county assessor before closing.
Climate risk First Street
- Flood 1/10 Low FEMA zone X (unshaded) · 0% chance over 30 yrs
- Wildfire 1/10 Low
- Heat 3/10 Moderate 7 d/yr ≥103°F today · 16 d/yr by 30 yrs out
- Wind 2/10 Low
- Air quality 2/10 Low 1 unhealthy d/yr today · 1 by 30 yrs out
Nearby sold comps map
Loading sold comps map…
Walkable amenities ~0.75 mi
Loading nearby amenities…
Taxation est. · year 1
- Rental income
- $24,310
- − Mortgage interest
- −$13,724
- − Property taxes
- −$3,403
- − Insurance
- −$1,225
- − Repairs & maintenance
- −$1,945
- − Management
- −$1,945
- − HOA
- −$156
- − Depreciation
- −$7,127
- Taxable loss
- −$5,215
- Est. tax savings @ 24.0%
- +$1,252
- After-tax cash flow
- $255/yr
For passive investors: Depreciation is non-cash, so a rental often shows a tax loss while cash-flowing — sheltering income. Rental losses are passive: they offset passive income freely, and up to $25,000/yr can offset ordinary (W-2) income if you actively participate and your MAGI is under $100k (phasing out to $0 by $150k); unused losses carry forward. On sale, claimed depreciation is recaptured at up to 25%, and gains may owe capital-gains tax (a 1031 exchange can defer both). Figures are a year-1 estimate at your 24.0% rate — not tax advice; consult a CPA.
Schools (NCES district)
- District
- Millard Public Schools
- NCES district ID
- 3173740
- Math proficiency
- 58% ▼ -7.00%
- Reading proficiency
- 60% ▼ -6.00%
- Median HH income
- $81,146
- Composite
- 53.23/100
- National rank
- #1500
- State rank
- #13 of 111 in NE
Livability — Chalco
- Score
- 79/100
- State rank
- #46
- US rank
- #2335
Category grades
Schools grade is shown separately in the Schools card above.
Census & demographics
- Census place
- Chalco, NE
- County
- Sarpy County · 161,202 people
- Metro
- Omaha-Council Bluffs, NE-IA
- Population (ZIP)
- 11,713
- Household income
- $86,007
- Rent vs Own
- Severe rent burden
- 303.0
Population outlook (Sarpy County) Hauer SSP2
- Today (2025)
- 211,769 people
- By 2030
- 229,365 · +8.3%
- By 2040
- 264,122 · +24.7%
- By 2050
- 298,087 · +40.8%
- By 2075
- 381,667 · +80.2%
- By 2100
- 448,180 · +111.6%
Race, ethnicity, and origin ACS 2023
- Neighborhood character
- Predominantly White (84%)
- Race & ethnicity
- White 84% Hispanic / Latino 9% Two or more races 7% Asian 2%
- Hispanic origin (detail)
- Mexican 6% Cuban 1%
- Common ancestry
- Romanian 5% Italian 5% Lithuanian 3%
- Foreign-born
- 3% · Canada
- Languages at home
- 97% English-only · Spanish 1% Other Indo-European 1%
Political lean MEDSL · Sarpy
- 2024 margin
- R (+11.7) · D 43.5% · R 55.2% · Other 1.3%
- 2008→2024 swing
- +4.2pp toward D · 2008: -15.9pp · 2024: -11.7pp
- All cycles
- 2024: R+11.7 2020: R+11.2 2016: R+21.8 2012: R+23.6 2008: R+15.9
Not yet ingested
- Civics
- —
Market trends
- HPI YoY
- ▼ -61.11%
- Current HPI
- 250.0183
- Rent YoY
- ▲ 3.73%
- Metro
- Omaha-Council Bluffs, NE-IA
- State GDP YoY
- ▲ 0.68%
- F500 in state
- 2
Industry mix (Fortune 500 HQ in NE)
| Industry | F500 HQs | Revenue |
|---|---|---|
| Conglomerate | 1 | $371B |
|
||
Price history
+155.2% since first listed17 events — show timeline
- 2026-06-04 Listed $245,000 GPRMLS
- 2022-11-16 Sold (Public Records) $170,000 Public Records
- 2022-11-10 Sold (MLS) $170,000 GPRMLS
- 2022-10-11 Pending — GPRMLS
- 2022-10-10 Price Changed $189,900 GPRMLS
- 2022-09-29 Relisted — GPRMLS
- 2022-09-23 Pending — GPRMLS
- 2022-09-15 Price Changed $194,900 GPRMLS
- 2022-09-06 Listed $200,000 GPRMLS
- 2020-10-14 Sold (Public Records) $135,000 Public Records
- 2020-10-09 Sold (MLS) $135,000 GPRMLS
- 2020-09-08 Pending — GPRMLS
- 2020-09-04 Listed $129,900 GPRMLS
- 2009-11-02 Sold (Public Records) $95,000 Public Records
- 2009-10-28 Sold (MLS) $95,000 GPRMLS
- 2009-09-17 Listing Removed — GPRMLS
- 2009-07-19 Listed $96,000 GPRMLS
Property tax history
+4.7%/yrLatest (2025): $3,403 · +4.4% YoY. Source: county tax records.
Cash-flow waterfall
monthlySold comps — $/sqft
last 12 mo · ≤1 miLoading sold comps…