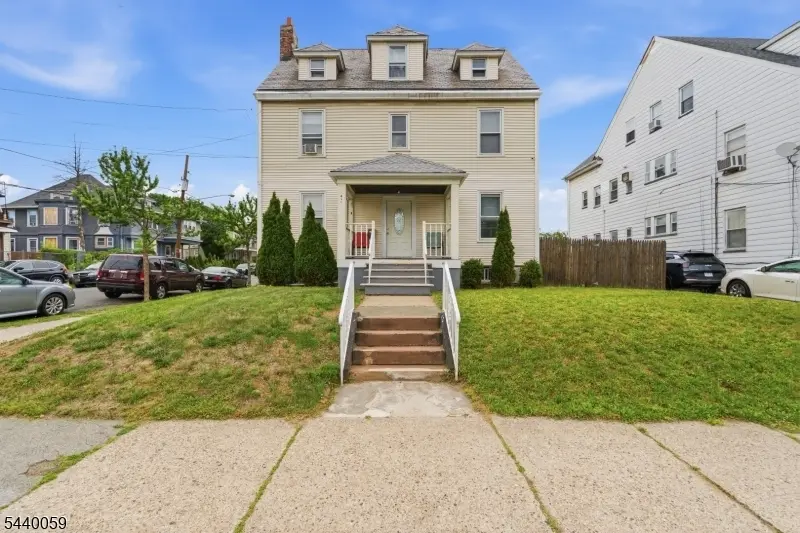
411 15th Ave
Paterson, NJ 07504
$669,999F
15 bd · 12.0 ba ·
2,434 sqft ·
Built —
· SingleFamily
· Active
· 3 DOM
Cashflow @ list (25.0% down · 7.5%)
Estimated rent
$2,958/mo
Mortgage (P&I)
−$3,514
Tax + insurance
−$1,454
HOA
−$0
Vac / Maint / Mgmt
−$621
Net cashflow
$-2,631/mo
Annual
$-31,567/yr
Cap rate
1.58%
Cash-on-cash
-16.83%
DSCR
0.25
1% rule
0.44%
Cash to close
$187,600
Investor read
- This is a 15-bed/12.0-bath single-family listed at $670k.
- At list price, monthly cash flow is $-3k ($-32k/yr) — negative.
- To cash-flow at today's rent, offer at most $282k (57.9% below list).
- To meet the 1% rule (rent ≥ 1% of price), the offer needs to be $296k (55.8% below list).
- Only 3 days on market — expect competitive offers; lowballing is unlikely to land.
- Recommended offer: $282k (57.9% below list) — sets the bar for cash-flow.
- Local home prices are declining (-3.0%/yr); year-one equity from $5k of loan paydown is wiped out by about $20k of value loss. Plan a longer hold.
- Location reads 69/100 on livability (#293 in NJ) — a middle-class / working-renter tenant base. Strengths: amenities A+, commute A+, health & safety A; Watch: schools D, employment D, crime F.
- Paterson Public School District (suburban): math 6% / reading 26% proficiency, ranked #458 of 472 in NJ (top 97%) — low school quality limits family demand, transient renter base, plan for 1-2y turnover; 83% free/reduced lunch — lower-income household profile, screen leases tightly.
- Market conditions: 5 active listings in the ZIP; solid renter incomes; 860 units permitted in Passaic County in 2024 (614 in 5+ unit buildings).
- Passaic County population projected at +5% by 2050 — modest demand growth; plan on rents tracking national, not racing it.
- Current owner paid $157k; list at $670k implies a 327% gain — meaningful room to come down on a strong offer.
- Climate carrying-cost: major wind risk, 27% chance of damaging wind over 30y; extreme-heat days projected 7→15/yr by 2055 (HVAC capex compounding) — expect insurance premiums to compound above CPI over the hold.
- Cap rate 1.6% vs local median 3.4% in Paterson — below-typical yield; the buyer is paying a premium for something (appreciation thesis, condition, location) that the cap rate doesn't capture.
- At $2,958/mo this rent would consume 46% of the median local household income ($77k/yr) (locally 704% of renters already pay >50% of income on rent) — very limited rent-growth headroom before tenants either downsize or default.
Questions for listing agent
- What do current leases actually rent for vs. the listed asking? Can we see a recent rent roll and the last 12 months of T-12 income?
- Is there a deadline driving the sale (1031 exchange, divorce, estate, relocation)? That informs how much negotiation room exists.
- Schools are D-rated, which usually means shorter tenancies and higher turnover. Who's the typical renter profile here, and what's been the actual vacancy rate?
- Crime grade is F in this area — have there been break-ins, vandalism, or insurance claims at this property in the last 3 years? What carrier currently insures it and at what premium?
- The area grade is low — what's the realistic commute time and amenity access for the typical tenant pool here? Any planned neighborhood developments (good or bad) we should know about?
- What's the average days-on-market for RENTAL listings here right now (not sales)? A rising rental-DOM trend means longer vacancies and softer asking-rent achievability than the comps imply.
- What's the recent tenant-quality profile in this submarket — average credit score on applications, eviction rate, late-payment / NSF rate, and stable-employment percentage? A property-management company in the area should have these aggregated.
- How much new for-sale + rental construction is in the pipeline within 1–3 miles? Heavy new supply typically softens prices + rents 12–24 months out; constrained supply supports both.
CashFlowRE · CFR-FBC8TCERPHKZ60
· Data 2 days ago
cashflowre.app · 2026-05-29