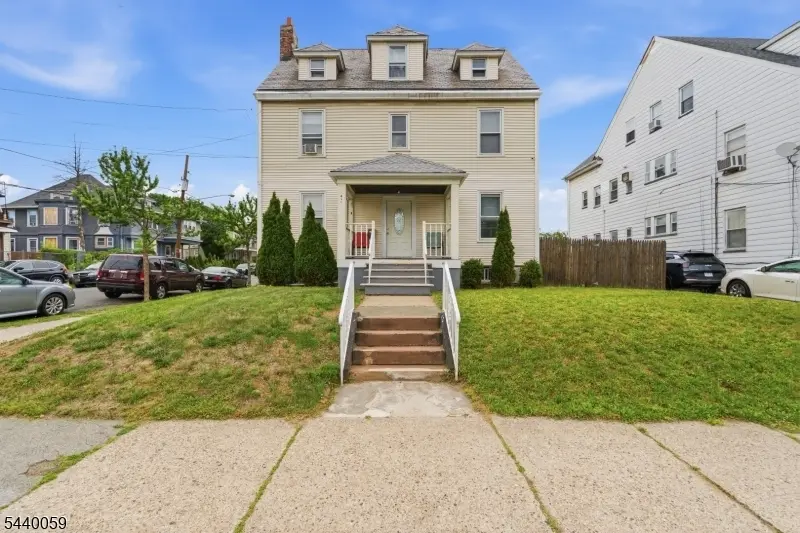
411 15th Ave · Paterson, NJ
Flood risk 1/10 · Minimal
- FEMA flood zone
- X (unshaded)
- Chance of flooding over 30 yrs
- 0.0%
- Est. flood insurance / yr
- $507 – $1,088
Fire risk 1/10 · Minimal
- Est. fire insurance / yr
- $526 – $976
Heat risk 7/10 · Major
- Hot days now (above 100°F)
- 7 days/yr
- Hot days in 30 yrs
- 15 days/yr
Wind risk 6/10 · Moderate
- Chance of severe wind over 30 yrs
- 27.0%
Air-quality risk 4/10 · Minor
- Unhealthy air days now
- 3 days/yr
- Unhealthy air days in 30 yrs
- 5 days/yr
Risk factors via First Street. Map © Google.
Why this score? — see what drove the F grade
The composite is a weighted blend of 9 inputs, each scored 0–100. Each bar is that input's sub-score; the figure is the points it added to the 100-point composite (weight × sub-score).
- ARV discount +7.5/15.0
- Livability +3.5/5.0
- Rent growth +2.5/5.0
- Condition / age +2.5/5.0
- Cash flow +1.5/30.0
- Schools +1.3/10.0
- 1% rule +0.0/10.0
- DSCR +0.0/10.0
- Appreciation +0.0/10.0
$669,999
🖨 Deal sheet 📄 Offer letter ✓ Due diligence
Listing remarks MLS
Don?t miss this well-maintained 3-family property situated on a desirable corner lot, offering excellent income potential and owner-occupant flexibility. Featuring three spacious units, including two 2-bedroom apartments, this property provides a versatile layout.The home boasts strong curb appeal, generous natural light, and a detached 2-car garage with additional driveway parking. The corner location enhances privacy and accessibility while providing extra outdoor space. Conveniently located near shopping, dining, public transportation, schools, and major highways.
Key facts
- Versatile layout
- Income potential
- Strong curb appeal
Tags
Property features AI
Exterior
- Utilities: Natural gas available and connected; Electricity connected
- Home design: Residential income property; Multi-family
Interior
- Bathrooms: 4 full bathrooms
- Interior features: 15 total rooms
- Laundry & utility: Laundry in basement
Neighborhood map
What this means for you Summary
Snapshot
- This is a 15-bed/12.0-bath single-family listed at $670k.
Deal economics
- At list price, monthly cash flow is $-3k ($-32k/yr) — negative.
- To cash-flow at today's rent, offer at most $282k (57.9% below list).
- To meet the 1% rule (rent ≥ 1% of price), the offer needs to be $296k (55.8% below list).
- Recommended offer: $282k (57.9% below list) — sets the bar for cash-flow.
- Cap rate 1.6% vs local median 3.4% in Paterson — below-typical yield; the buyer is paying a premium for something (appreciation thesis, condition, location) that the cap rate doesn't capture.
Location & tenants
- Location reads 69/100 on livability (#293 in NJ) — a middle-class / working-renter tenant base. Strengths: amenities A+, commute A+, health & safety A; Watch: schools D, employment D, crime F.
- Paterson Public School District (suburban): math 6% / reading 26% proficiency, ranked #458 of 472 in NJ (top 97%) — low school quality limits family demand, transient renter base, plan for 1-2y turnover; 83% free/reduced lunch — lower-income household profile, screen leases tightly.
- Market conditions: 5 active listings in the ZIP; solid renter incomes; 860 units permitted in Passaic County in 2024 (614 in 5+ unit buildings).
- At $2,958/mo this rent would consume 46% of the median local household income ($77k/yr) (locally 704% of renters already pay >50% of income on rent) — very limited rent-growth headroom before tenants either downsize or default.
Forward outlook
- Local home prices are declining (-3.0%/yr); year-one equity from $5k of loan paydown is wiped out by about $20k of value loss. Plan a longer hold.
- Passaic County population projected at +5% by 2050 — modest demand growth; plan on rents tracking national, not racing it.
Negotiation context
- Only 3 days on market — expect competitive offers; lowballing is unlikely to land.
- Current owner paid $157k; list at $670k implies a 327% gain — meaningful room to come down on a strong offer.
Risks & watch-outs
- Climate carrying-cost: major wind risk, 27% chance of damaging wind over 30y; extreme-heat days projected 7→15/yr by 2055 (HVAC capex compounding) — expect insurance premiums to compound above CPI over the hold.
Questions for the listing agent
- What do current leases actually rent for vs. the listed asking? Can we see a recent rent roll and the last 12 months of T-12 income?
- Is there a deadline driving the sale (1031 exchange, divorce, estate, relocation)? That informs how much negotiation room exists.
- Schools are D-rated, which usually means shorter tenancies and higher turnover. Who's the typical renter profile here, and what's been the actual vacancy rate?
- Crime grade is F in this area — have there been break-ins, vandalism, or insurance claims at this property in the last 3 years? What carrier currently insures it and at what premium?
- The area grade is low — what's the realistic commute time and amenity access for the typical tenant pool here? Any planned neighborhood developments (good or bad) we should know about?
- What's the average days-on-market for RENTAL listings here right now (not sales)? A rising rental-DOM trend means longer vacancies and softer asking-rent achievability than the comps imply.
- What's the recent tenant-quality profile in this submarket — average credit score on applications, eviction rate, late-payment / NSF rate, and stable-employment percentage? A property-management company in the area should have these aggregated.
- How much new for-sale + rental construction is in the pipeline within 1–3 miles? Heavy new supply typically softens prices + rents 12–24 months out; constrained supply supports both.
Investment metrics
- 1% rule
- 0.44% ✗
- Cap rate
- 1.58%
- Cash-on-cash
- -16.83%
- DSCR
- 0.25
- GRM
- 18.9
CMA / ARV
No comps found within radius.
Projected returns pro-forma
-3.0% appreciation · 3.0% rent growth · sell at horizon
- IRR
- -49.4%
- Equity multiple
- -0.47×
- Total profit
- $-275,858
- Equity at exit
- $99,899
- IRR
- -96.8%
- Equity multiple
- -1.42×
- Total profit
- $-454,924
- Equity at exit
- $57,929
Cash invested: $187,600 (down + closing). Projections, not guarantees.
Landlord ↔ Tenant lean methodology
- Overall (STATE)
- 21 Tenant-Leaning
- State New Jersey
- 21 Tenant-Leaning · D+6
- County
- — inherits STATE
- City
- — inherits STATE
ZIP-level market 07504
- Home prices YoY
- -20.8%
- Active inventory
- 5
- Price-to-rent
- 18.9×
Monthly cashflow live
- Estimated rent
- $2,958 medium interval (Pro) →
- Mortgage (P&I)
- −$3,514
- Tax from tax record
- −$1,175 /mo · $14,100/yr
- Insurance
- −$279
- HOA
- −$0
- Vacancy / Maint / Mgmt
- −$621
- Net cashflow
- $-2,631
Break-even live
UW: 25.0% down · 7.5% · 30yr · 1.5% tax · 5.0% vac · 8.0% maint · 8.0% mgmt
Financing live
Cash to close
- Down payment
- $167,500
- Closing costs
- $20,100
- Reserves months
- —
- Total cash needed
- —
Loan-product check · same deal, 3 products live
Conventional
25% down · 7.5% · 30yr
- Down + closing
- —
- Monthly P&I
- —
- Monthly cashflow
- —
- DSCR
- —
- Eligible?
- —
Personal DTI + credit; lowest rate.
DSCR
20% down · 8.5% · 30yr
- Down + closing
- —
- Monthly P&I
- —
- Monthly cashflow
- —
- DSCR
- —
- Eligible?
- —
No personal income docs; deal must DSCR.
Hard money
10% down · 12.0% · 12mo
- Down + closing
- —
- Monthly P&I
- —
- Monthly cashflow
- —
- DSCR
- —
- Eligible?
- —
Short-term bridge; refi at stabilization.
Listing history 4 events
-
2026-06-18days on market $669,999 Active 3 DOM
-
2026-06-17days on market $669,999 Active 2 DOM
-
2026-06-16remarks 574-char remark
Show marketing remark (573 chars)
Don?t miss this well-maintained 3-family property situated on a desirable corner lot, offering excellent income potential and owner-occupant flexibility. Featuring three spacious units, including two 2-bedroom apartments, this property provides a versatile layout.The home boasts strong curb appeal, generous natural light, and a detached 2-car garage with additional driveway parking. The corner location enhances privacy and accessibility while providing extra outdoor space. Conveniently located near shopping, dining, public transportation, schools, and major highways.
-
2026-06-16$669,999 Active 1 DOM
Show marketing remark (573 chars)
Don?t miss this well-maintained 3-family property situated on a desirable corner lot, offering excellent income potential and owner-occupant flexibility. Featuring three spacious units, including two 2-bedroom apartments, this property provides a versatile layout.The home boasts strong curb appeal, generous natural light, and a detached 2-car garage with additional driveway parking. The corner location enhances privacy and accessibility while providing extra outdoor space. Conveniently located near shopping, dining, public transportation, schools, and major highways.
ⓘ Source: listings_history table (triggers on properties + properties_extension) + one-shot
backfill from property_details.listing_events for pre-trigger history.
Tax reassessment forecast NJ · Partial reset (capped growth)
- Current annual tax
- $14,100 · $1,175/mo
- Projected year-2 tax
- $15,392 · $1,283/mo
- Expected delta
- +$1,291/yr (+$108/mo · 9.2%)
ⓘ Screening estimate from a state-policy table — verify with the county assessor before closing.
Climate risk First Street
- Flood 1/10 Low FEMA zone X (unshaded) · 0% chance over 30 yrs
- Wildfire 1/10 Low
- Heat 7/10 Severe 7 d/yr ≥100°F today · 15 d/yr by 30 yrs out
- Wind 6/10 Major 27% chance of damaging wind over 30 yrs
- Air quality 4/10 Moderate 3 unhealthy d/yr today · 5 by 30 yrs out
Nearby sold comps map
Loading sold comps map…
Walkable amenities ~0.75 mi
Loading nearby amenities…
Taxation est. · year 1
- Rental income
- $35,502
- − Mortgage interest
- −$37,530
- − Property taxes
- −$14,100
- − Insurance
- −$3,350
- − Repairs & maintenance
- −$2,840
- − Management
- −$2,840
- − Depreciation
- −$19,491
- Taxable loss
- −$44,650
- Est. tax savings @ 24.0%
- +$10,716
- After-tax cash flow
- $-20,851/yr
For passive investors: Depreciation is non-cash, so a rental often shows a tax loss while cash-flowing — sheltering income. Rental losses are passive: they offset passive income freely, and up to $25,000/yr can offset ordinary (W-2) income if you actively participate and your MAGI is under $100k (phasing out to $0 by $150k); unused losses carry forward. On sale, claimed depreciation is recaptured at up to 25%, and gains may owe capital-gains tax (a 1031 exchange can defer both). Figures are a year-1 estimate at your 24.0% rate — not tax advice; consult a CPA.
Schools (NCES district)
- District
- Paterson Public School District
- NCES district ID
- 3412690
- Math proficiency
- 6% ▼ -12.00%
- Reading proficiency
- 26% ▼ -4.00%
- Median HH income
- $34,365
- Composite
- 13.02/100
- National rank
- #9568
- State rank
- #458 of 472 in NJ
Livability — Paterson
- Score
- 69/100
- State rank
- #293
- US rank
- #8763
Category grades
Schools grade is shown separately in the Schools card above.
Census & demographics
- Census place
- Paterson, NJ
- County
- Passaic County · 360,294 people
- City population
- 85,452
- Metro
- New York-Newark-Jersey City, NY-NJ-PA
- Population (ZIP)
- 13,123
- Household income
- $76,659
- Rent vs Own
- Severe rent burden
- 704.0
Population outlook (Passaic County) Hauer SSP2
- Today (2025)
- 525,915 people
- By 2030
- 532,160 · +1.2%
- By 2040
- 543,670 · +3.4%
- By 2050
- 554,326 · +5.4%
- By 2075
- 584,728 · +11.2%
- By 2100
- 598,978 · +13.9%
Race, ethnicity, and origin ACS 2023
- Neighborhood character
- Majority Hispanic (58%)
- Race & ethnicity
- Hispanic / Latino 58% Black 38% Two or more races 28% White 2%
- Hispanic origin (detail)
- Mexican 4% Puerto Rican 10% Dominican 34%
- Foreign-born
- 44% · Canada, Jamaica, Guatemala
- Languages at home
- 50% English-only · Spanish 50%
Political lean MEDSL · Passaic
- 2024 margin
- Toss-up / Even · D 46.9% · R 49.8% · Other 3.3%
- 2008→2024 swing
- -24.6pp toward R · 2008: 21.7pp · 2024: -2.9pp
- All cycles
- 2024: R+2.9 2020: D+16.5 2016: D+21.8 2012: D+27.3 2008: D+21.7
Not yet ingested
- Civics
- —
Market trends
- HPI YoY
- ▼ -83.13%
- Current HPI
- 317.4387
- Rent YoY
- —
- Metro
- New York-Newark-Jersey City, NY-NJ-PA
- State GDP YoY
- ▲ 2.05%
- F500 in state
- 34
Industry mix (Fortune 500 HQ in NJ)
| Industry | F500 HQs | Revenue |
|---|---|---|
| Consumer Goods | 3 | $31B |
|
||
| Pharmaceuticals | 2 | $153B |
|
||
| Technology | 2 | $21B |
|
||
| Insurance | 2 | $20B |
|
||
| Healthcare | 2 | $19B |
|
||
| Financial Services | 1 | $70B |
|
||
Price history
+415.4% since first listed5 events — show timeline
- 2026-06-16 Listed $669,999 NJMLS
- 2026-06-16 Coming Soon $669,999 GSMLS
- 2012-06-11 Sold (Public Records) $157,000 Public Records
- 2000-07-28 Sold (Public Records) $159,000 Public Records
- 1990-05-10 Sold (Public Records) $130,000 Public Records
Property tax history
+3.3%/yrLatest (2025): $14,100 · +4.7% YoY. Source: county tax records.
Cash-flow waterfall
monthlySold comps — $/sqft
last 12 mo · ≤1 miLoading sold comps…