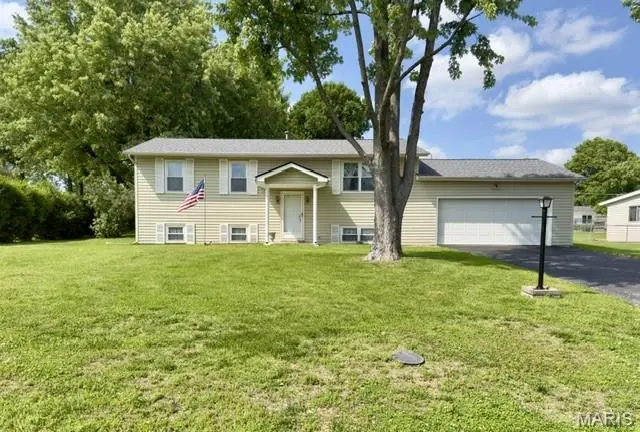
5 Milky Way Dr
Weldon Spring, MO 63304
$275,000D+
3 bd · 1.5 ba ·
1,290 sqft ·
Built 1966
· SingleFamily
· Pending
· 15 DOM
Cashflow @ list (25.0% down · 7.5%)
Estimated rent
$2,241/mo
Mortgage (P&I)
−$1,442
Tax + insurance
−$325
HOA
−$0
Vac / Maint / Mgmt
−$471
Net cashflow
$3/mo
Annual
$37/yr
Cap rate
6.31%
Cash-on-cash
0.05%
DSCR
1.00
1% rule
0.82%
Cash to close
$77,000
Investor read
- This is a 3-bed/1.5-bath single-family listed at $275k.
- At list price, monthly cash flow is $3 ($37/yr) — positive.
- The deal already cash-flows at list — no discount required.
- To meet the 1% rule (rent ≥ 1% of price), the offer needs to be $224k (18.5% below list).
- It's been on market 15 days — a 2% lower offer ($271k) is reasonable based on typical stale-listing flexibility.
- Recommended offer: $224k (18.5% below list) — sets the bar for 1% rule.
- Local home prices are declining (-3.0%/yr); year-one equity from $2k of loan paydown is wiped out by about $8k of value loss. Plan a longer hold.
- Location reads 73/100 on livability (#78 in MO) — a middle-class / working-renter tenant base. Strengths: crime A+, employment A+, housing A+; Watch: health & safety C-, amenities F, commute F.
- Francis Howell R-III (suburban): math 53% / reading 63% proficiency, ranked #11 of 324 in MO (top 3%) — acceptable for families but not a draw, mixed tenant base, ~2y average lease; only 15% free/reduced lunch — higher-income household profile.
- Zoned schools: Independence Elem. (math 63% / reading 69%, grade B+, #60 of 1,115 statewide, top 5%, 753 students, 10% FRL); Bryan Middle (math 52% / reading 62%, grade B, #33 of 391 statewide, top 9%, 813 students, 15% FRL); Francis Howell High (math 50% / reading 71%, grade C+, #33 of 521 statewide, top 6%, 1,835 students, 8% FRL) — zoned schools at 11% FRL track the district average.
- Market conditions: Rents rising (+2.5%/yr); 283 active listings in the ZIP; 2 comparable units currently listed for rent nearby; high-income renter base; 2,021 units permitted in St. Charles County in 2024 (568 in 5+ unit buildings).
- St. Charles County population projected at +22% by 2050 — long-run rental-demand tailwind backs the buy-and-hold thesis.
- Cap rate 6.3% vs local median 2.4% in Weldon Spring — top-decile yield for the area; either an underpriced asset or a hidden risk that comps aren't pricing in. Stress-test before assuming the spread holds.
Questions for listing agent
- Built in 1966 — when were the roof, HVAC, electrical panel, plumbing, and water heater last replaced?
- Is there a deadline driving the sale (1031 exchange, divorce, estate, relocation)? That informs how much negotiation room exists.
- Schools are A-rated — typically a magnet for longer-tenancy family renters. What's the average tenant stay here, and is there a school-zone premium baked into asking?
- The area grade is low — what's the realistic commute time and amenity access for the typical tenant pool here? Any planned neighborhood developments (good or bad) we should know about?
- What's the average days-on-market for RENTAL listings here right now (not sales)? A rising rental-DOM trend means longer vacancies and softer asking-rent achievability than the comps imply.
- What's the recent tenant-quality profile in this submarket — average credit score on applications, eviction rate, late-payment / NSF rate, and stable-employment percentage? A property-management company in the area should have these aggregated.
- How much new for-sale + rental construction is in the pipeline within 1–3 miles? Heavy new supply typically softens prices + rents 12–24 months out; constrained supply supports both.
CashFlowRE · CFR-FBE3RS2Y976MGB
· Data 1 week ago
cashflowre.app · 2026-05-29