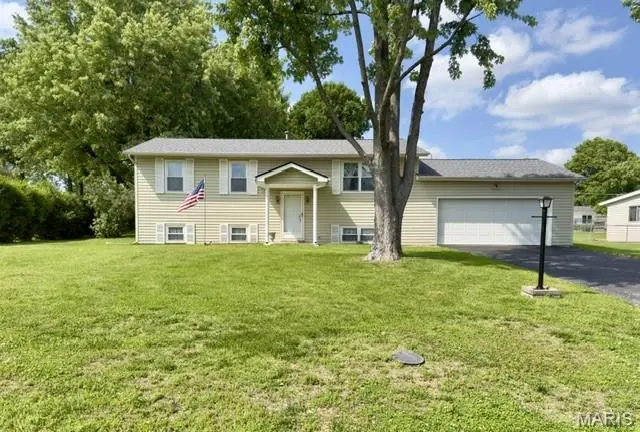
5 Milky Way Dr · Weldon Spring, MO
Flood risk 1/10 · Minimal
- FEMA flood zone
- X (unshaded)
- Chance of flooding over 30 yrs
- 0.0%
- Est. flood insurance / yr
- $473 – $860
Fire risk 1/10 · Minimal
- Est. fire insurance / yr
- $1,054 – $1,958
Heat risk 4/10 · Minor
- Hot days now (above 107°F)
- 7 days/yr
- Hot days in 30 yrs
- 19 days/yr
Wind risk 2/10 · Minimal
- Chance of severe wind over 30 yrs
- 1.0%
Air-quality risk 2/10 · Minimal
- Unhealthy air days now
- 2 days/yr
- Unhealthy air days in 30 yrs
- 2 days/yr
Risk factors via First Street. Map © Google.
Why this score? — see what drove the D+ grade
The composite is a weighted blend of 9 inputs, each scored 0–100. Each bar is that input's sub-score; the figure is the points it added to the 100-point composite (weight × sub-score).
- Cash flow +13.4/30.0
- ARV discount +12.9/15.0
- Schools +5.2/10.0
- DSCR +4.0/10.0
- Livability +3.7/5.0
- 1% rule +3.2/10.0
- Rent growth +3.1/5.0
- Condition / age +2.5/5.0
- Appreciation +0.0/10.0
$275,000
🖨 Deal sheet (PDF) 📄 Offer letter ✓ Due diligence
Listing remarks
Back on the market. Located in the established Skyview subdivision, this split-foyer home offers 3 bedrooms, 1.5 baths, and 1,290 total square feet on a generous . 41-acre interior lot. Step into the main level where a bright living room flows into the dining area, both with carpeting — and original hardwood flooring preserved underneath. The kitchen features a gas oven/range, and down the hall are three bedrooms with wood flooring, along with a full bathroom and a private half bath in the primary bedroom. The lower level includes a large laundry room, a concrete-floor storage area, and an additional carpeted room with an egress window that can serve as a sleeping area. Recent updates
Key facts
- 0.41 acre lot
- 2 garage spots
- Built 1966
Property features AI
Finance
- Other: Home warranty included; Seller may consider concessions
- Financial info: Lease not considered
Exterior
- Parking: Attached oversized garage (2 garage spaces) and off-street parking — total 2 parking spaces
- Utilities: Public water; Public sewer; Electric: other; Cable available
- Home design: Single-family residence; Private ownership; One and one-half levels; Fixer condition
- Construction: Vinyl siding
- Exterior features: Deck; Back yard with chain link fencing; Interior lot (approx. 0.413 acres); Lot dimensions approximately 101 x 190 x 99
Interior
- Kitchen: Kitchen on main level with gas appliances
- Bedrooms: 3 bedrooms on the main level; Sleeping area (approx. 24x14)
- Flooring: Carpet; Wood
- Bathrooms: 1 full bathroom on main level; 1 half bathroom on main level
- Heating & cooling: Forced air heating; Central air conditioning; Ceiling fans; Attic fan
- Interior features: Gas oven and gas range; 8+ ft poured basement with egress window and storage space; Attic fan, ceiling fans
- Laundry & utility: Laundry room in the basement
Neighborhood map
What this means for you Summary
Snapshot
- This is a 3-bed/1.5-bath single-family listed at $275k.
Deal economics
- At list price, monthly cash flow is $3 ($37/yr) — positive.
- The deal already cash-flows at list — no discount required.
- To meet the 1% rule (rent ≥ 1% of price), the offer needs to be $224k (18.5% below list).
- Recommended offer: $224k (18.5% below list) — sets the bar for 1% rule.
- Cap rate 6.3% vs local median 2.4% in Weldon Spring — top-decile yield for the area; either an underpriced asset or a hidden risk that comps aren't pricing in. Stress-test before assuming the spread holds.
Location & tenants
- Location reads 73/100 on livability (#78 in MO) — a middle-class / working-renter tenant base. Strengths: crime A+, employment A+, housing A+; Watch: health & safety C-, amenities F, commute F.
- Francis Howell R-III (suburban): math 53% / reading 63% proficiency, ranked #11 of 324 in MO (top 3%) — acceptable for families but not a draw, mixed tenant base, ~2y average lease; only 15% free/reduced lunch — higher-income household profile.
- Zoned schools: Independence Elem. (math 63% / reading 69%, grade B+, #60 of 1,115 statewide, top 5%, 753 students, 10% FRL); Bryan Middle (math 52% / reading 62%, grade B, #33 of 391 statewide, top 9%, 813 students, 15% FRL); Francis Howell High (math 50% / reading 71%, grade C+, #33 of 521 statewide, top 6%, 1,835 students, 8% FRL) — zoned schools at 11% FRL track the district average.
- Market conditions: Rents rising (+2.5%/yr); 283 active listings in the ZIP; 2 comparable units currently listed for rent nearby; high-income renter base; 2,021 units permitted in St. Charles County in 2024 (568 in 5+ unit buildings).
Forward outlook
- Local home prices are declining (-3.0%/yr); year-one equity from $2k of loan paydown is wiped out by about $8k of value loss. Plan a longer hold.
- St. Charles County population projected at +22% by 2050 — long-run rental-demand tailwind backs the buy-and-hold thesis.
Negotiation context
- It's been on market 15 days — a 2% lower offer ($271k) is reasonable based on typical stale-listing flexibility.
Questions for the listing agent
- Built in 1966 — when were the roof, HVAC, electrical panel, plumbing, and water heater last replaced?
- Is there a deadline driving the sale (1031 exchange, divorce, estate, relocation)? That informs how much negotiation room exists.
- Schools are A-rated — typically a magnet for longer-tenancy family renters. What's the average tenant stay here, and is there a school-zone premium baked into asking?
- The area grade is low — what's the realistic commute time and amenity access for the typical tenant pool here? Any planned neighborhood developments (good or bad) we should know about?
- What's the average days-on-market for RENTAL listings here right now (not sales)? A rising rental-DOM trend means longer vacancies and softer asking-rent achievability than the comps imply.
- What's the recent tenant-quality profile in this submarket — average credit score on applications, eviction rate, late-payment / NSF rate, and stable-employment percentage? A property-management company in the area should have these aggregated.
- How much new for-sale + rental construction is in the pipeline within 1–3 miles? Heavy new supply typically softens prices + rents 12–24 months out; constrained supply supports both.
Investment metrics
- 1% rule
- 0.82% ✗
- Cap rate
- 6.31%
- Cash-on-cash
- 0.05%
- DSCR
- 1.00
- GRM
- 10.2
CMA / ARV
- ARV (on-the-fly)
- $312,180
- Comps found
- 5
Show comp detail 5 sales within ~0.75 mi
| Address | Dist | Beds/Ba | Sqft | Sold | Price | $/sf | Match |
|---|---|---|---|---|---|---|---|
| 801 Haversham Dr | 0.41mi | 3/2.0 | 1,404 (+9%) | 5mo | $360,000 | $256 | 60 |
| 2 Towers Ln | 0.59mi | 4/2.0 (+1) | 1,325 (+3%) | 11mo | $320,000 | $242 | 52 |
| 728 Jacobs Crossing Drive Dr | 0.33mi | 4/3.0 (+1) | 1,400 (+8%) | 13mo | $529,000 | $378 | 48 |
| 1010 Haversham Ct | 0.61mi | 3/2.0 | 1,400 (+8%) | 23mo | $325,000 | $232 | 36 |
| 75 S Langfield Ct | 0.69mi | 3/2.5 | 1,458 (+13%) | 16mo | $349,900 | $240 | 28 |
Match score weights: distance 35% · size 25% · config 20% · recency 20%. Top-matched comps best support the ARV.
Projected returns pro-forma
-3.0% appreciation · 2.52% rent growth · sell at horizon
- IRR
- -16.8%
- Equity multiple
- 0.41×
- Total profit
- $-45,490
- Equity at exit
- $41,003
- IRR
- -9.5%
- Equity multiple
- 0.43×
- Total profit
- $-43,930
- Equity at exit
- $23,777
Cash invested: $77,000 (down + closing). Projections, not guarantees.
Landlord ↔ Tenant lean methodology
- Overall (STATE)
- 81 Strongly Landlord-Friendly
- State Missouri
- 81 Strongly Landlord-Friendly · R+10
- County
- — inherits STATE
- City
- — inherits STATE
ZIP-level market 63304
- Rents YoY
- 2.5%
- Active inventory
- 283
- Price-to-rent
- 10.2×
Monthly cashflow live
- Estimated rent
- $2,241 medium interval (Pro) →
- Mortgage (P&I)
- −$1,442
- Tax from tax record
- −$211 /mo · $2,530/yr
- Insurance
- −$115
- HOA
- −$0
- Vacancy / Maint / Mgmt
- −$471
- Net cashflow
- $3
Break-even live
Sensitivity live
| Price | -10% $159 | -5% $81 | +0% $3 | +5% $-75 | +10% $-153 |
|---|---|---|---|---|---|
| Rent | -10% $-174 | -5% $-85 | +0% $3 | +5% $92 | +10% $180 |
| Rate | -1.0pp $142 | -0.5pp $73 | base $3 | +0.5pp $-68 | +1.0pp $-141 |
UW: 25.0% down · 7.5% · 30yr · 1.5% tax · 5.0% vac · 8.0% maint · 8.0% mgmt
Financing live
Cash to close
- Down payment
- $68,750
- Closing costs
- $8,250
- Reserves months
- —
- Total cash needed
- —
Loan-product check · same deal, 3 products live
Conventional
25% down · 7.5% · 30yr
- Down + closing
- —
- Monthly P&I
- —
- Monthly cashflow
- —
- DSCR
- —
- Eligible?
- —
Personal DTI + credit; lowest rate.
DSCR
20% down · 8.5% · 30yr
- Down + closing
- —
- Monthly P&I
- —
- Monthly cashflow
- —
- DSCR
- —
- Eligible?
- —
No personal income docs; deal must DSCR.
Hard money
10% down · 12.0% · 12mo
- Down + closing
- —
- Monthly P&I
- —
- Monthly cashflow
- —
- DSCR
- —
- Eligible?
- —
Short-term bridge; refi at stabilization.
Rent comps 2 comps
| Address | Beds | Baths | Sqft | Rent | $/sqft | DOM | Units | Dist |
|---|---|---|---|---|---|---|---|---|
| 3891 Cambridge Crossing Dr Saint Charles, MO | 3.0 | 2.0 | 1509 | $2,396 | $1.59 | 5d | 1 | 0.93mi |
| 1400 Navaho Trl Saint Charles, MO | 4.0 | 2.0 | 1700 | $2,166 | $1.27 | 13d | 1 | 1.21mi |
Listing history 6 events
-
2026-06-13statusdays on market $275,000 Pending 15 DOM
-
2026-06-09days on market $275,000 Active 13 DOM
-
2026-06-08days on market $275,000 Active 12 DOM
-
2026-06-07statusdays on market $275,000 Active 11 DOM
-
2026-05-19$275,000 Active
-
2026-05-18historical $275,000
ⓘ Source: listings_history table (triggers on properties + properties_extension) + one-shot
backfill from property_details.listing_events for pre-trigger history.
Tax reassessment forecast MO · Resets to sale price
- Current annual tax
- $2,530 · $211/mo
- Projected year-2 tax
- $2,668 · $222/mo
- Expected delta
- +$138/yr (+$11/mo · 5.4%)
ⓘ Screening estimate from a state-policy table — verify with the county assessor before closing.
Climate risk First Street
- Flood 1/10 Low FEMA zone X (unshaded) · 0% chance over 30 yrs
- Wildfire 1/10 Low
- Heat 4/10 Moderate 7 d/yr ≥107°F today · 19 d/yr by 30 yrs out
- Wind 2/10 Low 100% chance of damaging wind over 30 yrs
- Air quality 2/10 Low 2 unhealthy d/yr today · 2 by 30 yrs out
Nearby sold comps map
Loading sold comps map…
Walkable amenities ~0.75 mi
Loading nearby amenities…
Taxation est. · year 1
- Rental income
- $26,896
- − Mortgage interest
- −$15,404
- − Property taxes
- −$2,530
- − Insurance
- −$1,375
- − Repairs & maintenance
- −$2,152
- − Management
- −$2,152
- − Depreciation
- −$8,000
- Taxable loss
- −$4,717
- Est. tax savings @ 24.0%
- +$1,132
- After-tax cash flow
- $1,169/yr
For passive investors: Depreciation is non-cash, so a rental often shows a tax loss while cash-flowing — sheltering income. Rental losses are passive: they offset passive income freely, and up to $25,000/yr can offset ordinary (W-2) income if you actively participate and your MAGI is under $100k (phasing out to $0 by $150k); unused losses carry forward. On sale, claimed depreciation is recaptured at up to 25%, and gains may owe capital-gains tax (a 1031 exchange can defer both). Figures are a year-1 estimate at your 24.0% rate — not tax advice; consult a CPA.
Schools (NCES district)
- District
- Francis Howell R-III
- NCES district ID
- 2928950
- Math proficiency
- 53% ▼ -12.00%
- Reading proficiency
- 63% ▼ -5.00%
- Median HH income
- $79,768
- Composite
- 52.23/100
- National rank
- #1602
- State rank
- #11 of 324 in MO
Livability — Weldon Spring
- Score
- 73/100
- State rank
- #78
- US rank
- #5250
Category grades
Schools grade is shown separately in the Schools card above.
Census & demographics
- County
- Saint Charles County · 399,703 people
- Metro
- St. Louis, MO-IL
- Population (ZIP)
- 43,195
- Household income
- $114,442
- Rent vs Own
- Severe rent burden
- 560.0
Population outlook (St. Charles County) Hauer SSP2
- Today (2025)
- 437,857 people
- By 2030
- 461,707 · +5.4%
- By 2040
- 503,222 · +14.9%
- By 2050
- 534,684 · +22.1%
- By 2075
- 597,047 · +36.4%
- By 2100
- 609,682 · +39.2%
Race, ethnicity, and origin ACS 2023
- Neighborhood character
- Predominantly White (87%)
- Race & ethnicity
- White 87% Two or more races 4% Hispanic / Latino 4% Black 4% Asian 2%
- Common ancestry
- Lithuanian 3% Romanian 3% Italian 3%
- Foreign-born
- 5% · Canada
- Languages at home
- 95% English-only · Spanish 2% Other Indo-European 1% Russian/Polish/Slavic 1%
Political lean MEDSL · St. Charles
- 2024 margin
- R (+17.0) · D 40.8% · R 57.8% · Other 1.4%
- 2008→2024 swing
- -7.2pp toward R · 2008: -9.7pp · 2024: -17.0pp
- All cycles
- 2024: R+17.0 2020: R+17.5 2016: R+26.4 2012: R+21.0 2008: R+9.7
Not yet ingested
- Civics
- —
Market trends
- HPI YoY
- ▼ -225.72%
- Current HPI
- 233.745
- Rent YoY
- ▲ 2.52%
- Metro
- St. Louis, MO-IL
- State GDP YoY
- ▲ 1.84%
- F500 in state
- 20
Industry mix (Fortune 500 HQ in MO)
| Industry | F500 HQs | Revenue |
|---|---|---|
| Healthcare | 1 | $163B |
|
||
| Insurance | 1 | $21B |
|
||
| Industrial Technology | 1 | $17B |
|
||
| Retail | 1 | $16B |
|
||
| Industrial Distribution | 1 | $10B |
|
||
| Utilities | 1 | $9B |
|
||
Price history
+0.0% since first listed2 events — show timeline
- 2026-05-19 Listed $275,000 MARIS as Distributed by MLS Grid
- 2026-05-18 Coming Soon $275,000 MARIS as Distributed by MLS Grid
Property tax history
+4.0%/yrLatest (2025): $2,530 · +1.4% YoY. Source: county tax records.
Cash-flow waterfall
monthlySold comps — $/sqft
last 12 mo · ≤1 miLoading sold comps…