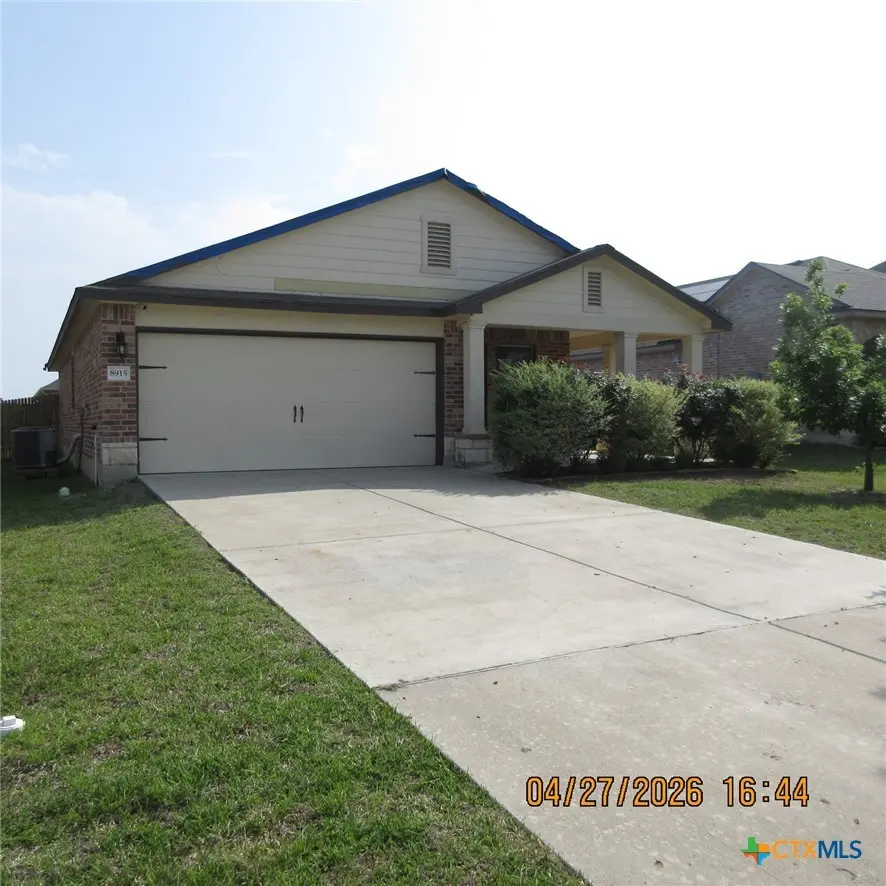
8915 Sky Crest Dr
Temple, TX 76502
$129,000C
3 bd · 2.0 ba ·
1,657 sqft ·
Built 2020
· SingleFamily
· Pending
· 12 DOM
Cashflow @ list (25.0% down · 7.5%)
Estimated rent
$1,845/mo
Mortgage (P&I)
−$676
Tax + insurance
−$580
HOA
−$0
Vac / Maint / Mgmt
−$387
Net cashflow
$201/mo
Annual
$2,410/yr
Cap rate
8.16%
Cash-on-cash
6.67%
DSCR
1.30
1% rule
1.43%
Cash to close
$36,120
Investor read
- This is a 3-bed/2.0-bath single-family listed at $129k. Condition is rated poor.
- At list price, monthly cash flow is $201 ($2k/yr) — positive.
- The deal already cash-flows at list — no discount required.
- Meets the 1% rule at list price ($2k rent vs $129k).
- Only 12 days on market — expect competitive offers; lowballing is unlikely to land.
- Local home prices are declining (-3.0%/yr); year-one equity from $892 of loan paydown is wiped out by about $4k of value loss. Plan a longer hold.
- Location reads 75/100 on livability (#122 in TX, #3,814 nationally) — a middle-class / working-renter tenant base. Strengths: cost of living A+, housing A+, health & safety A+; Watch: commute C-, crime D+, employment D+.
- Belton ISD (suburban): math 39% / reading 46% proficiency, ranked #285 of 826 in TX (top 34%) — families likely to look elsewhere, expect single-tenant / working-renter base with shorter leases.
- Zoned schools: Tarver El (math 40% / reading 46%, grade F, #1,283 of 4,322 statewide, top 30%, 798 students, 33% FRL); North Belton Middle (math 39% / reading 42%, grade F, #637 of 1,662 statewide, top 39%, 857 students, 38% FRL); Belton H S (math 39% / reading 46%, grade F, #721 of 1,632 statewide, top 45%, 1,941 students, 46% FRL) — zoned schools at 39% FRL track the district average.
- Watch-outs: property tax is 4.9% of price.
- Market conditions: Rents soft (-0.8%/yr); 1126 active listings in the ZIP; 40 comparable units currently listed for rent nearby; rentals lingering (median 46d on market — plan ~5-8 weeks vacancy on turnover, expect pricing pressure); 55% of comp listings sitting > 30 days — soft ceiling on asking rent; solid renter incomes; 3,222 units permitted in Bell County in 2024 (246 in 5+ unit buildings).
- Bell County population projected at +21% by 2050 — long-run rental-demand tailwind backs the buy-and-hold thesis.
- Climate carrying-cost: major wind risk, 77% chance of damaging wind over 30y; extreme-heat days projected 7→25/yr by 2055 (HVAC capex compounding) — expect insurance premiums to compound above CPI over the hold.
- Cap rate 8.2% vs local median 3.6% in Temple — top-decile yield for the area; either an underpriced asset or a hidden risk that comps aren't pricing in. Stress-test before assuming the spread holds.
Questions for listing agent
- Have any recent inspections been done? Can we get a copy of the seller's disclosures and any deferred-maintenance estimates?
- Property tax is high relative to price — has the assessment been appealed recently, and will the sale trigger a re-assessment?
- Is there a deadline driving the sale (1031 exchange, divorce, estate, relocation)? That informs how much negotiation room exists.
- Crime grade is D in this area — have there been break-ins, vandalism, or insurance claims at this property in the last 3 years? What carrier currently insures it and at what premium?
- What's the average days-on-market for RENTAL listings here right now (not sales)? A rising rental-DOM trend means longer vacancies and softer asking-rent achievability than the comps imply.
- What's the recent tenant-quality profile in this submarket — average credit score on applications, eviction rate, late-payment / NSF rate, and stable-employment percentage? A property-management company in the area should have these aggregated.
- How much new for-sale + rental construction is in the pipeline within 1–3 miles? Heavy new supply typically softens prices + rents 12–24 months out; constrained supply supports both.
Repairs flagged (vision-AI assessment)
- Major: Exposed framing — Structural elements are not yet complete
CashFlowRE · CFR-FBSK7S4C9KV9K1
· Data 1 week ago
cashflowre.app · 2026-05-29