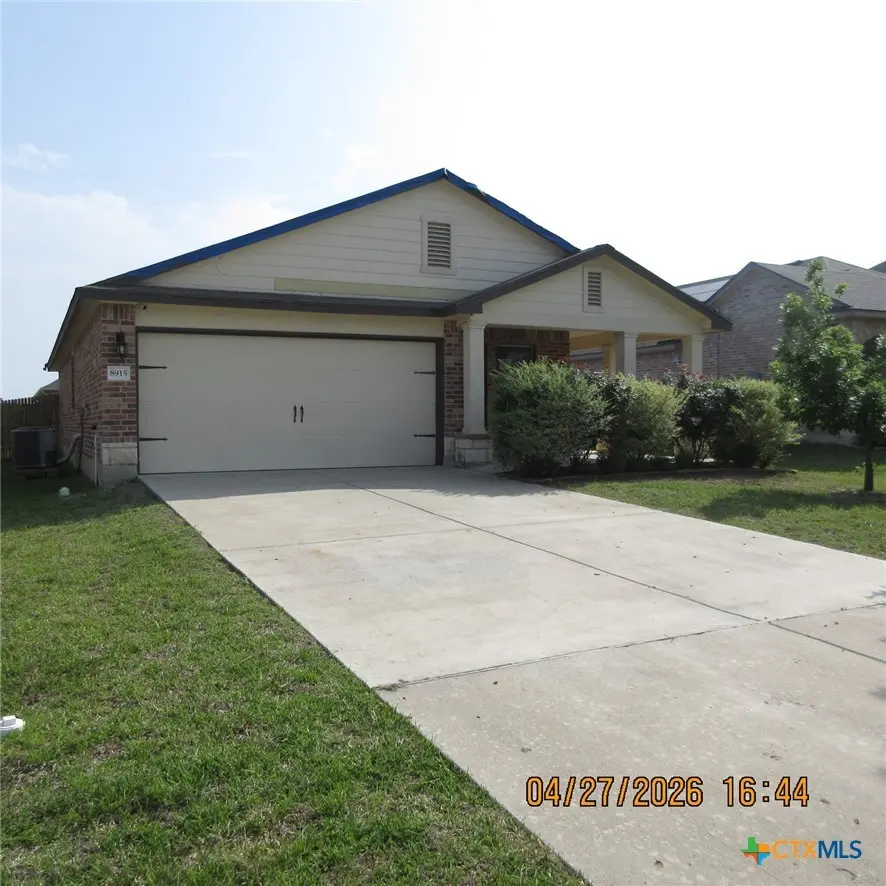
8915 Sky Crest Dr · Temple, TX
Flood risk 1/10 · Minimal
- FEMA flood zone
- X (unshaded)
- Chance of flooding over 30 yrs
- 0.0%
- Est. flood insurance / yr
- $507 – $1,088
Fire risk 4/10 · Minor
- Est. fire insurance / yr
- $1,222 – $2,270
Heat risk 8/10 · Major
- Hot days now (above 108°F)
- 7 days/yr
- Hot days in 30 yrs
- 25 days/yr
Wind risk 6/10 · Moderate
- Chance of severe wind over 30 yrs
- 77.0%
Air-quality risk 2/10 · Minimal
- Unhealthy air days now
- 0 days/yr
- Unhealthy air days in 30 yrs
- 1 days/yr
Risk factors via First Street. Map © Google.
Why this score? — see what drove the C grade
The composite is a weighted blend of 9 inputs, each scored 0–100. Each bar is that input's sub-score; the figure is the points it added to the 100-point composite (weight × sub-score).
- Cash flow +21.8/30.0
- 1% rule +9.3/10.0
- ARV discount +7.5/15.0
- DSCR +7.0/10.0
- Schools +3.8/10.0
- Livability +3.8/5.0
- Rent growth +2.3/5.0
- Condition / age +1.0/5.0
- Appreciation +0.0/10.0
$129,000
🖨 Deal sheet (PDF) 📄 Offer letter ✓ Due diligence
Listing remarks
"Due to condition, the property may have health/safety risk(s). Prior to entry / access, all parties must sign a Hold Harmless Agreement and the property may only be shown by appointment" Property offers 3 bedrooms, 2 baths, utility room, living room and kitchen open to breakfast area. Property has been identified as in FEMA Flood Zone Not mapped. This property may qualify for Seller Financing (Vendee). * * MULTIPLE OFFERS HAVE BEEN SUBMITTED-Highest & Best Hold Period active - expires 05/08/2026 01:00 PM CST * *
Key facts
- 5,998 sq ft lot
- 2 garage spots
- Built 2020
Property features AI
Finance
- HOA & community: Curbs
Exterior
- Parking: 2-car garage
- Utilities: Public water; Public sewer; Public trash collection
- Home design: Single-story home; City street frontage; City lot (less than quarter acre)
- Construction: Masonry construction; Composition/shingle roof; Slab foundation; Year built (assessor)
- Exterior features: Exterior details (see remarks); Privacy wood fencing
Interior
- Kitchen: Kitchen (see remarks for appliances)
- Bedrooms: Bedroom 2; Bedroom 3
- Bathrooms: 2 full bathrooms
- Interior features: Double vanity; Garden (Roman) tub; Separate shower; Tub and shower combination; Other interior features (see remarks)
- Laundry & utility: Washer hookup inside; Electric dryer hookup inside
Neighborhood map
What this means for you Summary
Snapshot
- This is a 3-bed/2.0-bath single-family listed at $129k. Condition is rated poor.
Deal economics
- At list price, monthly cash flow is $201 ($2k/yr) — positive.
- The deal already cash-flows at list — no discount required.
- Meets the 1% rule at list price ($2k rent vs $129k).
- Cap rate 8.2% vs local median 3.6% in Temple — top-decile yield for the area; either an underpriced asset or a hidden risk that comps aren't pricing in. Stress-test before assuming the spread holds.
Location & tenants
- Location reads 75/100 on livability (#122 in TX, #3,814 nationally) — a middle-class / working-renter tenant base. Strengths: cost of living A+, housing A+, health & safety A+; Watch: schools C-, commute C-, crime D+.
- Belton ISD (suburban): math 39% / reading 46% proficiency, ranked #285 of 826 in TX (top 34%) — families likely to look elsewhere, expect single-tenant / working-renter base with shorter leases.
- Market conditions: Rents soft (-0.8%/yr); 1118 active listings in the ZIP; 40 comparable units currently listed for rent nearby; rentals lingering (median 45d on market — plan ~5-8 weeks vacancy on turnover, expect pricing pressure); 55% of comp listings sitting > 30 days — soft ceiling on asking rent; solid renter incomes; 3,222 units permitted in Bell County in 2024 (246 in 5+ unit buildings).
Forward outlook
- Local home prices are declining (-3.0%/yr); year-one equity from $892 of loan paydown is wiped out by about $4k of value loss. Plan a longer hold.
- Bell County population projected at +21% by 2050 — long-run rental-demand tailwind backs the buy-and-hold thesis.
Negotiation context
- Only 12 days on market — expect competitive offers; lowballing is unlikely to land.
Risks & watch-outs
- Watch-outs: property tax is 4.9% of price.
- Climate carrying-cost: major wind risk, 77% chance of damaging wind over 30y; extreme-heat days projected 7→25/yr by 2055 (HVAC capex compounding) — expect insurance premiums to compound above CPI over the hold.
Questions for the listing agent
- Have any recent inspections been done? Can we get a copy of the seller's disclosures and any deferred-maintenance estimates?
- Property tax is high relative to price — has the assessment been appealed recently, and will the sale trigger a re-assessment?
- Is there a deadline driving the sale (1031 exchange, divorce, estate, relocation)? That informs how much negotiation room exists.
- Crime grade is D in this area — have there been break-ins, vandalism, or insurance claims at this property in the last 3 years? What carrier currently insures it and at what premium?
- What's the average days-on-market for RENTAL listings here right now (not sales)? A rising rental-DOM trend means longer vacancies and softer asking-rent achievability than the comps imply.
- What's the recent tenant-quality profile in this submarket — average credit score on applications, eviction rate, late-payment / NSF rate, and stable-employment percentage? A property-management company in the area should have these aggregated.
- How much new for-sale + rental construction is in the pipeline within 1–3 miles? Heavy new supply typically softens prices + rents 12–24 months out; constrained supply supports both.
Investment metrics
- 1% rule
- 1.43% ✓
- Cap rate
- 8.16%
- Cash-on-cash
- 6.67%
- DSCR
- 1.30
- GRM
- 5.8
CMA / ARV
- ARV (median comp)
- $280,557
- List price
- $129,000
- Delta
- -54.02%
- Verdict
- UNDERPRICED
- Comps
- 20 within 1.0 mi
Show comp detail 12 sales within ~0.75 mi
| Address | Dist | Beds/Ba | Sqft | Sold | Price | $/sf | Match |
|---|---|---|---|---|---|---|---|
| 8516 Cantera Ridge Rd | 0.31mi | 3/2.0 | 1,703 (+3%) | 2mo | $246,000 | $144 | 79 |
| 1517 Starlight Dr | 0.61mi | 3/2.0 | 1,641 (-1%) | 1mo | $235,500 | $144 | 69 |
| 922 Stone Valley Rd | 0.15mi | 4/2.0 (+1) | 1,852 (+12%) | 2mo | $255,000 | $138 | 67 |
| 8011 Timber Hollow Ln | 0.62mi | 3/2.0 | 1,576 (-5%) | 1mo | $295,000 | $187 | 62 |
| 9203 Lake Pointe Dr | 0.31mi | 3/2.0 | 1,874 (+13%) | 2mo | $269,000 | $144 | 62 |
| 8019 Timber Hollow Ln | 0.60mi | 3/2.0 | 1,565 (-6%) | 2mo | $287,500 | $184 | 61 |
| 8011 Pineridge Way | 0.64mi | 4/2.0 (+1) | 1,700 (+3%) | 2mo | $289,000 | $170 | 59 |
| 413 Weeping Willow Dr | 0.75mi | 3/2.0 | 1,708 (+3%) | 1mo | $250,000 | $146 | 59 |
| 7813 Smoke Creek Ln | 0.69mi | 3/2.0 | 1,580 (-5%) | 1mo | $270,000 | $171 | 59 |
| 7810 Timber Hollow Ln | 0.70mi | 4/2.0 (+1) | 1,700 (+3%) | 2mo | $289,000 | $170 | 57 |
| 8422 Alabama Ave | 0.39mi | 3/2.5 | 1,427 (-14%) | 1mo | $255,000 | $179 | 56 |
| 7919 Woodbury Dr | 0.70mi | 4/2.0 (+1) | 1,477 (-11%) | 1mo | $225,000 | $152 | 43 |
Match score weights: distance 35% · size 25% · config 20% · recency 20%. Top-matched comps best support the ARV.
Projected returns pro-forma
-3.0% appreciation · 0.0% rent growth · sell at horizon
- IRR
- -10.5%
- Equity multiple
- 0.63×
- Total profit
- $-13,269
- Equity at exit
- $19,234
- IRR
- -8.1%
- Equity multiple
- 0.59×
- Total profit
- $-14,957
- Equity at exit
- $11,154
Cash invested: $36,120 (down + closing). Projections, not guarantees.
Landlord ↔ Tenant lean methodology
- Overall (STATE)
- 87 Strongly Landlord-Friendly
- State Texas
- 87 Strongly Landlord-Friendly · R+5
- County
- — inherits STATE
- City
- — inherits STATE
ZIP-level market 76502
- Rents YoY
- -0.8%
- Active inventory
- 1118
- Price-to-rent
- 5.8×
Monthly cashflow live
- Estimated rent
- $1,845 high interval (Pro) →
- Mortgage (P&I)
- −$676
- Tax from tax record
- −$527 /mo · $6,319/yr
- Insurance
- −$54
- HOA
- −$0
- Vacancy / Maint / Mgmt
- −$387
- Net cashflow
- $201
Break-even live
Sensitivity live
| Price | -10% $655 | -5% $611 | +0% $201 | +5% $164 | +10% $128 |
|---|---|---|---|---|---|
| Rent | -10% $55 | -5% $128 | +0% $201 | +5% $274 | +10% $347 |
| Rate | -1.0pp $266 | -0.5pp $234 | base $201 | +0.5pp $167 | +1.0pp $133 |
UW: 25.0% down · 7.5% · 30yr · 1.5% tax · 5.0% vac · 8.0% maint · 8.0% mgmt
Financing live
Cash to close
- Down payment
- $32,250
- Closing costs
- $3,870
- Reserves months
- —
- Total cash needed
- —
Loan-product check · same deal, 3 products live
Conventional
25% down · 7.5% · 30yr
- Down + closing
- —
- Monthly P&I
- —
- Monthly cashflow
- —
- DSCR
- —
- Eligible?
- —
Personal DTI + credit; lowest rate.
DSCR
20% down · 8.5% · 30yr
- Down + closing
- —
- Monthly P&I
- —
- Monthly cashflow
- —
- DSCR
- —
- Eligible?
- —
No personal income docs; deal must DSCR.
Hard money
10% down · 12.0% · 12mo
- Down + closing
- —
- Monthly P&I
- —
- Monthly cashflow
- —
- DSCR
- —
- Eligible?
- —
Short-term bridge; refi at stabilization.
Rent comps 40 comps
| Address | Beds | Baths | Sqft | Rent | $/sqft | DOM | Units | Dist |
|---|---|---|---|---|---|---|---|---|
| 1012 Ribeye Rd Temple, TX | 4.0 | 2.0 | 1612 | $1,850 | $1.15 | 44d | 1 | 0.15mi |
| 1111 Porterhouse Rd Temple, TX | 3.0 | 2.0 | 1507 | $1,695 | $1.12 | 44d | 1 | 0.19mi |
| 1119 Stone Valley Rd Unit B Temple, TX | 4.0 | 2.0 | 1479 | $1,699 | $1.15 | 44d | 1 | 0.24mi |
| 8612 Cantera Ridge Rd Temple, TX | 4.0 | 2.0 | 1800 | $1,895 | $1.05 | 24d | 1 | 0.25mi |
| 1129 Stone Valley Rd Unit B Temple, TX | 4.0 | 2.0 | 1479 | $1,699 | $1.15 | 44d | 1 | 0.26mi |
| 1126 Stone Valley Rd Unit A Temple, TX | 4.0 | 2.0 | 1479 | $1,800 | $1.22 | 44d | 1 | 0.27mi |
| 8419 Brahma Plains Rd Temple, TX | 3.0 | 2.0 | 1489 | $1,800 | $1.21 | 44d | 1 | 0.34mi |
| 1211 Fawn Lily Dr Temple, TX | 4.0 | 2.5 | 2077 | $2,145 | $1.03 | 14d | 1 | 0.41mi |
| 619 Hollyhock Dr Temple, TX | 3.0 | 2.0 | 1443 | $1,800 | $1.25 | 14d | 1 | 0.45mi |
| 917 Hollyhock Dr Temple, TX | 4.0 | 2.0 | 1600 | $1,900 | $1.19 | 14d | 1 | 0.46mi |
| 1218 Iron Glen Dr Temple, TX | 3.0 | 2.0 | 2241 | $1,950 | $0.87 | 44d | 1 | 0.50mi |
| 8918 Night View Dr Temple, TX | 3.0 | 2.0 | 1506 | $1,649 | $1.09 | 24d | 1 | 0.51mi |
| 513 Fallbrook Dr Temple, TX | 3.0 | 2.0 | 1443 | $1,850 | $1.28 | 24d | 1 | 0.53mi |
| 1411 Amber Dawn Dr Temple, TX | 3.0 | 2.0 | 1621 | $1,745 | $1.08 | 44d | 1 | 0.53mi |
| 1411 Amber Dawn Dr Temple, TX | 3.0 | 2.0 | 1621 | $1,695 | $1.05 | 14d | 1 | 0.53mi |
| 1315 Starlight Dr Temple, TX | 4.0 | 2.0 | 1735 | $1,875 | $1.08 | 44d | 1 | 0.56mi |
| 8118 Timber Hollow Ln Temple, TX | 3.0 | 2.0 | 1596 | $1,795 | $1.12 | 24d | 1 | 0.57mi |
| 1016 Starlight Dr Temple, TX | 3.0 | 2.5 | 1519 | $1,895 | $1.25 | 44d | 1 | 0.57mi |
| 531 Parkfield Ln Temple, TX | 3.0 | 2.0 | 1287 | $1,700 | $1.32 | 44d | 1 | 0.58mi |
| 8112 Pineridge Way Temple, TX | 3.0 | 2.0 | 1580 | $1,895 | $1.20 | 44d | 1 | 0.60mi |
| 1309 Juneberry Park Dr Temple, TX | 3.0 | 2.0 | 1565 | $1,695 | $1.08 | 14d | 1 | 0.61mi |
| 9916 Orion Dr Temple, TX | 3.0 | 2.0 | 1458 | $1,725 | $1.18 | 44d | 1 | 0.63mi |
| 619 Starlight Dr Temple, TX | 3.0 | 2.0 | 1443 | $3,600 | $2.49 | 44d | 1 | 0.63mi |
| 8015 Pineridge Way Temple, TX | 4.0 | 2.0 | 1700 | $1,850 | $1.09 | 44d | 1 | 0.64mi |
| 918 Evergreen Farm Dr Temple, TX | 3.0 | 2.5 | 2062 | $1,930 | $0.94 | 44d | 1 | 0.64mi |
| 8012 Bridgepointe Dr Temple, TX | 3.0 | 2.0 | 1307 | $1,595 | $1.22 | 14d | 1 | 0.68mi |
| 811 Sugar Brook Dr Temple, TX | 3.0 | 2.0 | 1612 | $1,745 | $1.08 | 14d | 1 | 0.68mi |
| 10008 Smock Mill Ln Temple, TX | 3.0 | 2.0 | 1972 | $1,695 | $0.86 | 44d | 1 | 0.69mi |
| 8025 Redbrush Temple, TX | 3.0 | 2.0 | 1382 | $1,595 | $1.15 | 14d | 1 | 0.74mi |
| 8012 Redbrush Temple, TX | 3.0 | 2.0 | 1300 | $1,595 | $1.23 | 14d | 1 | 0.75mi |
| 748 Westfield Blvd Temple, TX | 3.0 | 2.5 | 1386 | $1,695 | $1.22 | 44d | 1 | 0.80mi |
| 740 Westfield Blvd Temple, TX | 2.0 | 2.5 | 1403 | $1,675 | $1.19 | 44d | 1 | 0.81mi |
| 460 S Cedar Rd Temple, TX | 1.0–3.0 | 1.0–2.0 | 972 | $1,679 | $1.73 | 14d | 6 | 0.82mi |
| 724 Westfield Blvd Temple, TX | 2.0 | 2.5 | 1403 | $1,675 | $1.19 | 24d | 1 | 0.82mi |
| 10208 Cap Rock Dr Temple, TX | 3.0 | 2.0 | 1905 | $2,195 | $1.15 | 24d | 1 | 0.82mi |
| 419 Big Timber Dr Temple, TX | 3.0 | 2.0 | 1771 | $1,995 | $1.13 | 44d | 1 | 0.84mi |
| 1245 Spring Terrace Loop Temple, TX | 3.0 | 2.0 | 1306 | $1,695 | $1.30 | 44d | 1 | 0.85mi |
| 10206 Alamosa Ln Temple, TX | 3.0 | 2.5 | 2162 | $2,300 | $1.06 | 44d | 1 | 0.86mi |
| 228 Big Timber Dr Temple, TX | 4.0 | 2.0 | 1919 | $1,895 | $0.99 | 24d | 1 | 0.88mi |
| 7523 Buffalo Grass Dr Temple, TX | 3.0 | 2.0 | 1587 | $1,795 | $1.13 | 24d | 1 | 0.92mi |
Listing history 2 events
-
2026-05-16status Pending 537-char remark
-
2026-05-02$129,000 Active 537-char remark
ⓘ Source: listings_history table (triggers on properties + properties_extension) + one-shot
backfill from property_details.listing_events for pre-trigger history.
Tax reassessment forecast TX · Resets to sale price
- Current annual tax
- $6,319 · $527/mo
- Projected year-2 tax
- $6,319 · $527/mo
- Expected delta
- $0/yr ($0/mo · 0.0%)
ⓘ Screening estimate from a state-policy table — verify with the county assessor before closing.
Climate risk First Street
- Flood 1/10 Low FEMA zone X (unshaded) · 0% chance over 30 yrs
- Wildfire 4/10 Moderate
- Heat 8/10 Severe 7 d/yr ≥108°F today · 25 d/yr by 30 yrs out
- Wind 6/10 Major 77% chance of damaging wind over 30 yrs
- Air quality 2/10 Low 0 unhealthy d/yr today · 1 by 30 yrs out
Nearby sold comps map
Loading sold comps map…
Walkable amenities ~0.75 mi
Loading nearby amenities…
Taxation est. · year 1
- Rental income
- $22,141
- − Mortgage interest
- −$7,226
- − Property taxes
- −$6,319
- − Insurance
- −$645
- − Repairs & maintenance
- −$1,771
- − Management
- −$1,771
- − Depreciation
- −$3,753
- Taxable income
- $656
- Est. tax owed @ 24.0%
- −$157
- After-tax cash flow
- $2,252/yr
For passive investors: Depreciation is non-cash, so a rental often shows a tax loss while cash-flowing — sheltering income. Rental losses are passive: they offset passive income freely, and up to $25,000/yr can offset ordinary (W-2) income if you actively participate and your MAGI is under $100k (phasing out to $0 by $150k); unused losses carry forward. On sale, claimed depreciation is recaptured at up to 25%, and gains may owe capital-gains tax (a 1031 exchange can defer both). Figures are a year-1 estimate at your 24.0% rate — not tax advice; consult a CPA.
Condition & rehab AI · 12 photos
This property is in an extensive state of construction, requiring significant work to be completed before it can be considered habitable or marketable.
Repairs flagged
- Major Exposed framing — Structural elements are not yet complete
Value-add opportunities
- Resale Complete kitchen and bathroom — Fully functional kitchens and bathrooms are essential for buyers
- Resale Complete exterior and landscaping — Aesthetic appeal is crucial for buyers
- Both Complete HVAC and electrical systems — These systems are critical for both buyers and renters
Renovation cost estimate screening
| Repair item | Severity | Est. cost |
|---|---|---|
| Exposed framing · Structural elements are not yet complete | Major | $15,000–50,000 |
| Total estimated repair cost · 1 items | $15,000–50,000 |
Value-add ROI direction
- Resale Complete kitchen and bathroom — Fully functional kitchens and bathrooms are essential for buyers ↑
- Resale Complete exterior and landscaping — Aesthetic appeal is crucial for buyers ↑
- Both Complete HVAC and electrical systems — These systems are critical for both buyers and renters ↑
ⓘ Cost ranges are severity-bucket heuristics (US national rule-of-thumb). Get contractor quotes + a written scope before underwriting a rehab budget.
Schools (NCES district)
- District
- Belton ISD
- NCES district ID
- 4809860
- Math proficiency
- 39% ▼ -14.00%
- Reading proficiency
- 46% ▼ -4.00%
- Median HH income
- $61,239
- Composite
- 37.62/100
- National rank
- #4378
- State rank
- #285 of 826 in TX
Livability — Temple
- Score
- 75/100
- State rank
- #122
- US rank
- #3814
Category grades
Schools grade is shown separately in the Schools card above.
Census & demographics
- Census place
- Temple, TX
- County
- Bell County · 345,090 people
- City population
- 96,587
- Metro
- Killeen-Temple, TX
- Population (ZIP)
- 52,669
- Household income
- $82,088
- Rent vs Own
- Severe rent burden
- 1890.0
Population outlook (Bell County) Hauer SSP2
- Today (2025)
- 371,114 people
- By 2030
- 389,104 · +4.8%
- By 2040
- 420,592 · +13.3%
- By 2050
- 447,779 · +20.7%
- By 2075
- 499,130 · +34.5%
- By 2100
- 505,680 · +36.3%
Race, ethnicity, and origin ACS 2023
- Neighborhood character
- Diverse neighborhood (Simpson 0.59)
- Race & ethnicity
- White 58% Hispanic / Latino 26% Two or more races 15% Black 9% Asian 3%
- Hispanic origin (detail)
- Mexican 21% Puerto Rican 2%
- Common ancestry
- Italian 2% Slovak 2% Serbian 1%
- Foreign-born
- 7% · Canada, South Korea, China
- Languages at home
- 86% English-only · Spanish 10% Other Indo-European 1% Korean 1%
Political lean MEDSL · Bell
- 2024 margin
- R (+16.2) · D 41.3% · R 57.6% · Other 1.1%
- 2008→2024 swing
- -6.5pp toward R · 2008: -9.8pp · 2024: -16.2pp
- All cycles
- 2024: R+16.2 2020: R+8.5 2016: R+15.1 2012: R+16.4 2008: R+9.8
Not yet ingested
- Civics
- —
Market trends
- HPI YoY
- ▼ -216.80%
- Current HPI
- 166.927
- Rent YoY
- ▼ -0.79%
- Metro
- Killeen-Temple, TX
- State GDP YoY
- ▲ 3.95%
- F500 in state
- 110
Industry mix (Fortune 500 HQ in TX)
| Industry | F500 HQs | Revenue |
|---|---|---|
| Energy | 16 | $1,198B |
|
||
| Technology | 5 | $198B |
|
||
| Engineering / Construction | 4 | $72B |
|
||
| Energy Services | 3 | $60B |
|
||
| Utilities | 3 | $41B |
|
||
| Healthcare | 2 | $330B |
|
||
Price history
2 events — show timeline
- 2026-05-16 Pending — CTXMLS
- 2026-05-02 Listed $129,000 CTXMLS
Property tax history
+35.2%/yrLatest (2026): $6,319 · -8.6% YoY. Source: county tax records.
Cash-flow waterfall
monthlySold comps — $/sqft
last 12 mo · ≤1 miLoading sold comps…