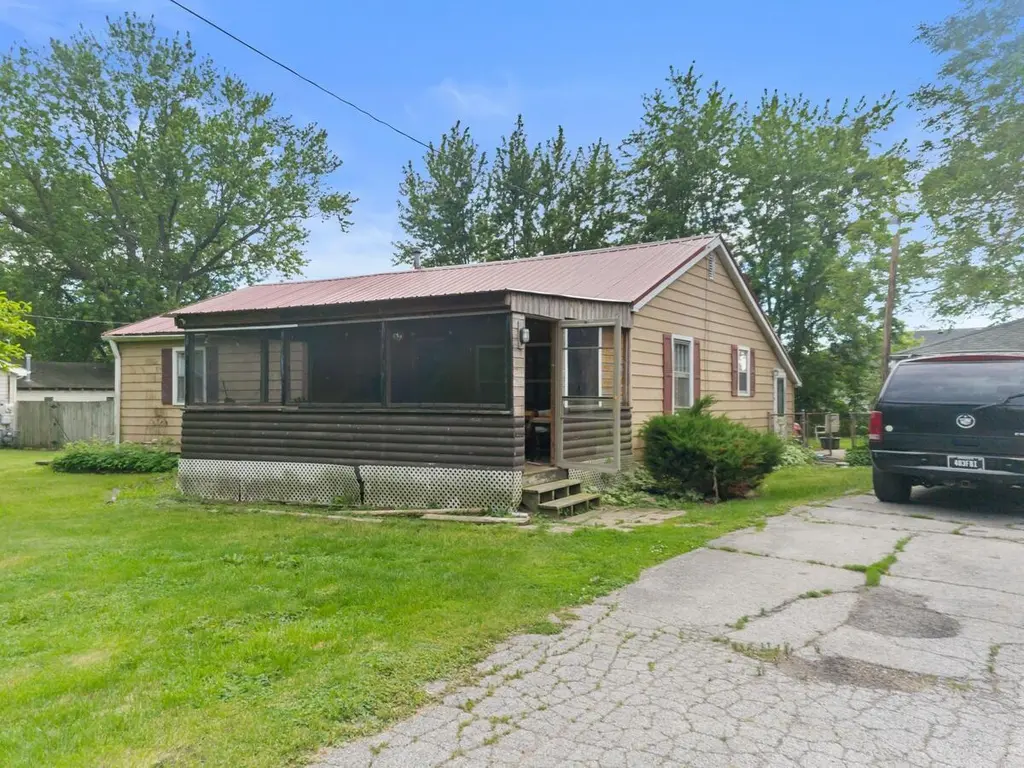
13722 Birch
Cedar Lake, IN 46303
$225,000C+
3 bd · 1.0 ba ·
1,292 sqft ·
Built 1949
· SingleFamily
· Active
· 22 DOM
Cashflow @ list (25.0% down · 7.5%)
Estimated rent
$2,328/mo
Mortgage (P&I)
−$1,180
Tax + insurance
−$185
HOA
−$0
Vac / Maint / Mgmt
−$489
Net cashflow
$474/mo
Annual
$5,691/yr
Cap rate
8.82%
Cash-on-cash
9.03%
DSCR
1.40
1% rule
1.03%
Cash to close
$63,000
Investor read
- This is a 3-bed/1.0-bath single-family listed at $225k.
- At list price, monthly cash flow is $474 ($6k/yr) — positive.
- The deal already cash-flows at list — no discount required.
- Meets the 1% rule at list price ($2k rent vs $225k).
- It's been on market 22 days — a 2% lower offer ($222k) is reasonable based on typical stale-listing flexibility.
- Recommended offer: $222k (1.5% below list) — sets the bar for market timing.
- Local home prices are declining (-3.0%/yr); year-one equity from $2k of loan paydown is wiped out by about $7k of value loss. Plan a longer hold.
- Location reads 65/100 on livability (#354 in IN) — a middle-class / working-renter tenant base. Strengths: crime A+, cost of living A+, housing A+; Watch: amenities F, commute F, health & safety F.
- Hanover Community School Corporation (suburban): math 49% / reading 53% proficiency, ranked #38 of 301 in IN (top 13%) — acceptable for families but not a draw, mixed tenant base, ~2y average lease; only 20% free/reduced lunch — higher-income household profile.
- Watch-outs: built in 1949 — expect roof / HVAC / electrical / plumbing capex.
- Market conditions: 265 active listings in the ZIP; 7 comparable units currently listed for rent nearby; rentals leasing fast (median 1d on market — plan ~1-2 weeks tenant-placement turnaround); solid renter incomes; 1,642 units permitted in Lake County in 2024 (14 in 5+ unit buildings).
- Lake County population projected to shrink 7% by 2050 — rents likely to lag national; underwrite the cash flow, not the appreciation.
- 5 sale attempts since 28y ago with the ask held roughly flat each time — persistent listings suggest the price (not the market) is what's stuck; bring a comps-based counter.
- Cap rate 8.8% vs local median 3.5% in Cedar Lake — top-decile yield for the area; either an underpriced asset or a hidden risk that comps aren't pricing in. Stress-test before assuming the spread holds.
- This rent runs 33% of the median local income ($84k/yr) — at the standard rent-burdened threshold; future hikes will face affordability resistance.
Questions for listing agent
- Built in 1949 — when were the roof, HVAC, electrical panel, plumbing, and water heater last replaced?
- Is there a deadline driving the sale (1031 exchange, divorce, estate, relocation)? That informs how much negotiation room exists.
- What's the average days-on-market for RENTAL listings here right now (not sales)? A rising rental-DOM trend means longer vacancies and softer asking-rent achievability than the comps imply.
- What's the recent tenant-quality profile in this submarket — average credit score on applications, eviction rate, late-payment / NSF rate, and stable-employment percentage? A property-management company in the area should have these aggregated.
- How much new for-sale + rental construction is in the pipeline within 1–3 miles? Heavy new supply typically softens prices + rents 12–24 months out; constrained supply supports both.
CashFlowRE · CFR-FEBWTP6AQRNRR4
· Data 2 days ago
cashflowre.app · 2026-05-29