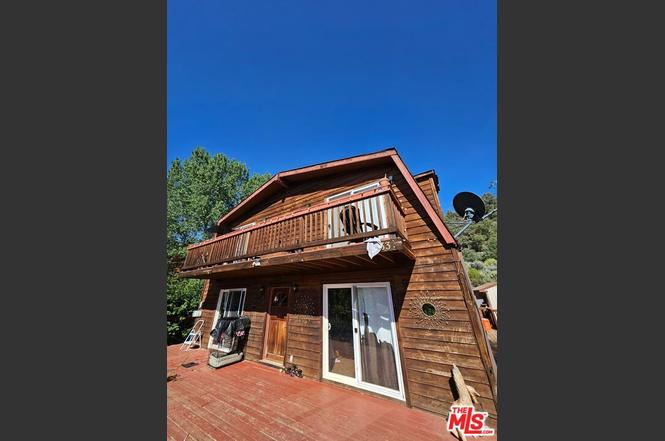
2033 Tulip Pl #6253
Pine Mountain Club, CA 93222
$259,000D+
3 bd · 3.0 ba ·
2,048 sqft ·
Built 1980
· SingleFamily
· Pending
· 272 DOM
Cashflow @ list (25.0% down · 7.5%)
Estimated rent
$2,554/mo
Mortgage (P&I)
−$1,358
Tax + insurance
−$652
HOA
−$161
Vac / Maint / Mgmt
−$536
Net cashflow
$-154/mo
Annual
$-1,851/yr
Cap rate
5.89%
Cash-on-cash
-1.43%
DSCR
0.94
1% rule
0.99%
Cash to close
$72,520
Investor read
- This is a 3-bed/3.0-bath single-family listed at $259k.
- At list price, monthly cash flow is $-154 ($-2k/yr) — negative.
- To cash-flow at today's rent, offer at most $232k (10.5% below list).
- To meet the 1% rule (rent ≥ 1% of price), the offer needs to be $255k (1.4% below list).
- It's been on market 272 days — a 12% lower offer ($228k) is reasonable based on typical stale-listing flexibility.
- Recommended offer: $228k (12.0% below list) — sets the bar for market timing.
- Local home prices are declining (-0.8%/yr); year-one equity from $2k of loan paydown is wiped out by about $2k of value loss. Plan a longer hold.
- Location reads 51/100 on livability (#1,081 in CA) — a working-class tenant base; expect higher turnover. Strengths: housing A, crime A-; Watch: schools C-, amenities F, commute F.
- El Tejon Unified (rural): math 13% / reading 45% proficiency, ranked #361 of 517 in CA (top 70%) — low school quality limits family demand, transient renter base, plan for 1-2y turnover.
- Watch-outs: flood insurance adds $68/mo.
- Market conditions: 147 active listings in the ZIP; 6 comparable units currently listed for rent nearby; rentals leasing fast (median 3d on market — plan ~1-2 weeks tenant-placement turnaround); 3,244 units permitted in Kern County in 2024 (73 in 5+ unit buildings).
- Kern County population projected at +17% by 2050 — long-run rental-demand tailwind backs the buy-and-hold thesis.
- 2 sale attempts; this cycle's ask has dropped $266k (51%) from the opening price — seller is motivated, your offer sets the floor, not the list.
- Climate carrying-cost: severe flood risk; severe wildfire risk — expect insurance premiums to compound above CPI over the hold.
- Cap rate 5.9% vs local median 3.1% in Pine Mountain Club — top-decile yield for the area; either an underpriced asset or a hidden risk that comps aren't pricing in. Stress-test before assuming the spread holds.
Questions for listing agent
- What do current leases actually rent for vs. the listed asking? Can we see a recent rent roll and the last 12 months of T-12 income?
- It's been on market 272 days. Have you received any prior offers? Is the seller open to a 12% concession, seller financing, or rate buy-down credit?
- What's the actual annual flood-insurance premium (NFIP or private), and is the property in a SFHA with mandatory coverage?
- What does the HOA fee cover, when was the last increase, and are there any pending special assessments or reserve-fund shortfalls?
- Why hasn't it sold? Are there any deal-killer items the seller is aware of (foundation, flood, title, zoning, code violations)?
- Is there a deadline driving the sale (1031 exchange, divorce, estate, relocation)? That informs how much negotiation room exists.
- The area grade is low — what's the realistic commute time and amenity access for the typical tenant pool here? Any planned neighborhood developments (good or bad) we should know about?
- What's the average days-on-market for RENTAL listings here right now (not sales)? A rising rental-DOM trend means longer vacancies and softer asking-rent achievability than the comps imply.
CashFlowRE · CFR-FEQXS8AFR6DPVH
· Data 3 weeks ago
cashflowre.app · 2026-05-29