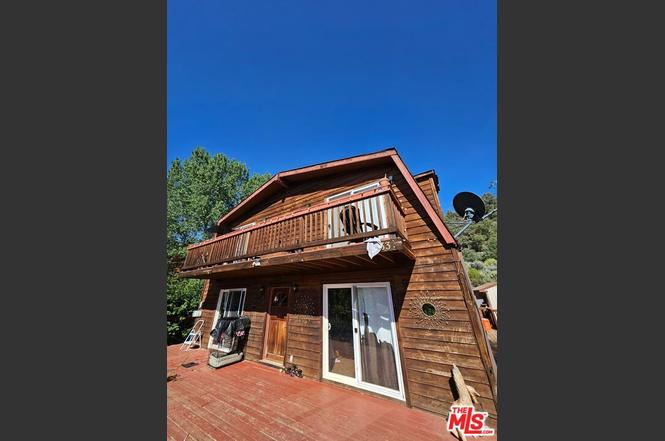
2033 Tulip Pl #6253 · Pine Mountain Club, CA
Flood risk 10/10 · Severe
- FEMA flood zone
- D
- Chance of flooding over 30 yrs
- 0.99%
- Est. flood insurance / yr
- $544 – $1,084
Fire risk 8/10 · Major
- Est. fire insurance / yr
- $659 – $1,223
Heat risk 2/10 · Minimal
- Hot days now (above 81°F)
- 12 days/yr
- Hot days in 30 yrs
- 29 days/yr
Wind risk 1/10 · Minimal
- Chance of severe wind over 30 yrs
- —
Air-quality risk 8/10 · Major
- Unhealthy air days now
- 16 days/yr
- Unhealthy air days in 30 yrs
- 19 days/yr
Risk factors via First Street. Map © Google.
Why this score? — see what drove the D+ grade
The composite is a weighted blend of 9 inputs, each scored 0–100. Each bar is that input's sub-score; the figure is the points it added to the 100-point composite (weight × sub-score).
- ARV discount +15.0/15.0
- Cash flow +11.5/30.0
- 1% rule +4.9/10.0
- Appreciation +4.6/10.0
- DSCR +3.4/10.0
- Livability +2.6/5.0
- Rent growth +2.5/5.0
- Schools +2.5/10.0
- Condition / age +2.5/5.0
$259,000
🖨 Deal sheet 📄 Offer letter ✓ Due diligence
Listing remarks
Major Fixer-Upper with huge potential in Pine Mountain Club! Buyer to purchase the property "as is" condition. Sale is subject to short sale approval by Lender. Rare oportunity for Developers and investors to create a custom mountain retreat, income property, or redevelopment project. Discover the perfect blend of nature, privacy, and mountain charm in this spaciouse home tucked away in beautiful Pine Mountain Club - just a short scenic drive from Los Angeles. Set among the tall pines with sweeping mountain views, this inviting retreat features over 2,000 sq. ft. of living space and an expansive wraparound deck ideal for relaxing or entertaining under the stars. Inside, enjoy a wa
Key facts
- Clubhouse
- Tennis court
- Biking trails
Tags
Neighborhood map
What this means for you Summary
Snapshot
- This is a 3-bed/3.0-bath single-family listed at $259k.
Deal economics
- At list price, monthly cash flow is $-154 ($-2k/yr) — negative.
- To cash-flow at today's rent, offer at most $232k (10.5% below list).
- To meet the 1% rule (rent ≥ 1% of price), the offer needs to be $255k (1.4% below list).
- Recommended offer: $228k (12.0% below list) — sets the bar for market timing.
- Cap rate 5.9% vs local median 3.1% in Pine Mountain Club — top-decile yield for the area; either an underpriced asset or a hidden risk that comps aren't pricing in. Stress-test before assuming the spread holds.
Location & tenants
- Location reads 51/100 on livability (#1,081 in CA) — a working-class tenant base; expect higher turnover. Strengths: housing A, crime A-; Watch: schools C-, amenities F, commute F.
- El Tejon Unified (rural): math 13% / reading 45% proficiency, ranked #361 of 517 in CA (top 70%) — low school quality limits family demand, transient renter base, plan for 1-2y turnover.
- Market conditions: 147 active listings in the ZIP; 6 comparable units currently listed for rent nearby; rentals leasing fast (median 3d on market — plan ~1-2 weeks tenant-placement turnaround); 3,244 units permitted in Kern County in 2024 (73 in 5+ unit buildings).
Forward outlook
- Local home prices are declining (-0.8%/yr); year-one equity from $2k of loan paydown is wiped out by about $2k of value loss. Plan a longer hold.
- Kern County population projected at +17% by 2050 — long-run rental-demand tailwind backs the buy-and-hold thesis.
Negotiation context
- It's been on market 272 days — a 12% lower offer ($228k) is reasonable based on typical stale-listing flexibility.
- 2 sale attempts; this cycle's ask has dropped $266k (51%) from the opening price — seller is motivated, your offer sets the floor, not the list.
Risks & watch-outs
- Watch-outs: flood insurance adds $68/mo.
- Climate carrying-cost: severe flood risk; severe wildfire risk — expect insurance premiums to compound above CPI over the hold.
Questions for the listing agent
- What do current leases actually rent for vs. the listed asking? Can we see a recent rent roll and the last 12 months of T-12 income?
- It's been on market 272 days. Have you received any prior offers? Is the seller open to a 12% concession, seller financing, or rate buy-down credit?
- What's the actual annual flood-insurance premium (NFIP or private), and is the property in a SFHA with mandatory coverage?
- What does the HOA fee cover, when was the last increase, and are there any pending special assessments or reserve-fund shortfalls?
- Why hasn't it sold? Are there any deal-killer items the seller is aware of (foundation, flood, title, zoning, code violations)?
- Is there a deadline driving the sale (1031 exchange, divorce, estate, relocation)? That informs how much negotiation room exists.
- The area grade is low — what's the realistic commute time and amenity access for the typical tenant pool here? Any planned neighborhood developments (good or bad) we should know about?
- What's the average days-on-market for RENTAL listings here right now (not sales)? A rising rental-DOM trend means longer vacancies and softer asking-rent achievability than the comps imply.
- What's the recent tenant-quality profile in this submarket — average credit score on applications, eviction rate, late-payment / NSF rate, and stable-employment percentage? A property-management company in the area should have these aggregated.
- How much new for-sale + rental construction is in the pipeline within 1–3 miles? Heavy new supply typically softens prices + rents 12–24 months out; constrained supply supports both.
Investment metrics
- 1% rule
- 0.99% ✗
- Cap rate
- 5.89%
- Cash-on-cash
- -1.43%
- DSCR
- 0.94
- GRM
- 8.5
CMA / ARV
- ARV (on-the-fly)
- $489,472
- Comps found
- 12
Show comp detail 12 sales within ~0.75 mi
| Address | Dist | Beds/Ba | Sqft | Sold | Price | $/sf | Match |
|---|---|---|---|---|---|---|---|
| 2045 Linden Dr | 0.18mi | 3/2.0 | 1,958 (-4%) | 15mo | $317,000 | $162 | 67 |
| 1513 Woodland | 0.57mi | 3/3.0 | 2,175 (+6%) | 2mo | $550,000 | $253 | 61 |
| 1804 Freeman Dr | 0.68mi | 4/3.0 (+1) | 2,088 (+2%) | 1mo | $380,000 | $182 | 59 |
| 2317 Woodland Dr | 0.41mi | 3/2.5 | 2,174 (+6%) | 14mo | $540,000 | $248 | 57 |
| 2208 Bernina | 0.59mi | 3/4.0 | 1,970 (-4%) | 8mo | $350,000 | $178 | 56 |
| 1709 Lassen Way | 0.67mi | 3/2.0 | 1,929 (-6%) | 10mo | $490,000 | $254 | 47 |
| 15524 Mil Potrero Hwy | 0.60mi | 3/2.0 | 1,827 (-11%) | 5mo | $437,500 | $239 | 46 |
| 15320 San Moritz Dr | 0.46mi | 3/2.0 | 1,792 (-12%) | 13mo | $415,000 | $232 | 43 |
| 2501 Innsbruck Ct | 0.64mi | 3/2.0 | 1,815 (-11%) | 12mo | $420,000 | $231 | 37 |
| 1721 Matterhorn Dr | 0.62mi | 4/3.0 (+1) | 1,805 (-12%) | 12mo | $475,000 | $263 | 36 |
| 15223 Nesthorn Way | 0.64mi | 3/2.5 | 1,753 (-14%) | 13mo | $435,000 | $248 | 33 |
| 1812 Bernina Dr | 0.73mi | 4/2.0 (+1) | 1,806 (-12%) | 9mo | $300,000 | $166 | 30 |
Match score weights: distance 35% · size 25% · config 20% · recency 20%. Top-matched comps best support the ARV.
Projected returns pro-forma
-0.83% appreciation · 3.0% rent growth · sell at horizon
- IRR
- -8.5%
- Equity multiple
- 0.63×
- Total profit
- $-27,098
- Equity at exit
- $64,597
- IRR
- -1.7%
- Equity multiple
- 0.83×
- Total profit
- $-12,008
- Equity at exit
- $69,617
Cash invested: $72,520 (down + closing). Projections, not guarantees.
Landlord ↔ Tenant lean methodology
- Overall (STATE)
- 18 Strongly Tenant-Friendly
- State California
- 18 Strongly Tenant-Friendly · D+13
- County
- — inherits STATE
- City
- — inherits STATE
ZIP-level market 93222
- Home prices YoY
- -0.3%
- Active inventory
- 147
- Price-to-rent
- 8.5×
Monthly cashflow live
- Estimated rent
- $2,554 high interval (Pro) →
- Mortgage (P&I)
- −$1,358
- Tax from tax record
- −$477 /mo · $5,720/yr
- Insurance
- −$108
- Flood insurance flood zone
- −$68 /mo · $814/yr
- HOA
- −$161
- Vacancy / Maint / Mgmt
- −$536
- Net cashflow
- $-154
Break-even live
UW: 25.0% down · 7.5% · 30yr · 1.5% tax · 5.0% vac · 8.0% maint · 8.0% mgmt
Financing live
Cash to close
- Down payment
- $64,750
- Closing costs
- $7,770
- Reserves months
- —
- Total cash needed
- —
Loan-product check · same deal, 3 products live
Conventional
25% down · 7.5% · 30yr
- Down + closing
- —
- Monthly P&I
- —
- Monthly cashflow
- —
- DSCR
- —
- Eligible?
- —
Personal DTI + credit; lowest rate.
DSCR
20% down · 8.5% · 30yr
- Down + closing
- —
- Monthly P&I
- —
- Monthly cashflow
- —
- DSCR
- —
- Eligible?
- —
No personal income docs; deal must DSCR.
Hard money
10% down · 12.0% · 12mo
- Down + closing
- —
- Monthly P&I
- —
- Monthly cashflow
- —
- DSCR
- —
- Eligible?
- —
Short-term bridge; refi at stabilization.
Rent comps 6 comps
| Address | Beds | Baths | Sqft | Rent | $/sqft | DOM | Units | Dist |
|---|---|---|---|---|---|---|---|---|
| 15325 Acacia Way Pine Mountain Club, CA | 3.0 | 2.0 | 1511 | $2,400 | $1.59 | 44d | 1 | 0.29mi |
| 14700 Voltaire Dr Frazier Park, CA | 4.0 | 3.0 | 2128 | $2,500 | $1.17 | 2d | 1 | 0.87mi |
| 1617 Zion Way Pine Mountain Club, CA | 3.0 | 2.0 | 1776 | $2,400 | $1.35 | 2d | 1 | 0.88mi |
| 2232 Ironwood Dr Pine Mountain Club, CA | 3.0 | 2.0 | 1700 | $2,550 | $1.50 | 3d | 1 | 1.30mi |
| 2235 Ironwood Dr Pine Mountain Club, CA | 3.0 | 2.0 | 1700 | $2,850 | $1.68 | 2d | 1 | 1.34mi |
| 16812 Sandalwood Dr Pine Mountain Club, CA | 3.0 | 2.5 | 2176 | $3,215 | $1.48 | 10d | 1 | 1.47mi |
HOA detail
- Monthly dues
- $161 · $1,932/yr
Listing history 12 events
-
2026-04-14status Pending
-
2026-04-14status Active
-
2026-04-11price $259,000
-
2026-01-26price $359,000
-
2025-12-09price $369,000
-
2025-08-20price $499,000
-
2025-07-11$525,000 Active
-
2022-04-06soldstatus $475,000
-
2011-09-29soldstatus $158,000
-
2003-02-28soldstatus $190,000
-
1996-11-01soldstatus $83,000
-
1980-11-26soldstatus $115,000
ⓘ Source: listings_history table (triggers on properties + properties_extension) + one-shot
backfill from property_details.listing_events for pre-trigger history.
Tax reassessment forecast CA · Resets to sale price
- Current annual tax
- $5,720 · $477/mo
- Projected year-2 tax
- $5,720 · $477/mo
- Expected delta
- $0/yr ($0/mo · 0.0%)
ⓘ Screening estimate from a state-policy table — verify with the county assessor before closing.
Climate risk First Street
- Flood 10/10 Extreme FEMA zone D · 99% chance over 30 yrs
- Wildfire 8/10 Severe
- Heat 2/10 Low 12 d/yr ≥81°F today · 29 d/yr by 30 yrs out
- Wind 1/10 Low
- Air quality 8/10 Severe 16 unhealthy d/yr today · 19 by 30 yrs out
Nearby sold comps map
Loading sold comps map…
Walkable amenities ~0.75 mi
Loading nearby amenities…
Taxation est. · year 1
- Rental income
- $30,644
- − Mortgage interest
- −$14,508
- − Property taxes
- −$5,720
- − Insurance
- −$2,109
- − Repairs & maintenance
- −$2,452
- − Management
- −$2,452
- − HOA
- −$1,932
- − Depreciation
- −$7,535
- Taxable loss
- −$6,062
- Est. tax savings @ 24.0%
- +$1,455
- After-tax cash flow
- $-396/yr
For passive investors: Depreciation is non-cash, so a rental often shows a tax loss while cash-flowing — sheltering income. Rental losses are passive: they offset passive income freely, and up to $25,000/yr can offset ordinary (W-2) income if you actively participate and your MAGI is under $100k (phasing out to $0 by $150k); unused losses carry forward. On sale, claimed depreciation is recaptured at up to 25%, and gains may owe capital-gains tax (a 1031 exchange can defer both). Figures are a year-1 estimate at your 24.0% rate — not tax advice; consult a CPA.
Schools (NCES district)
- District
- El Tejon Unified
- NCES district ID
- 0600026
- Math proficiency
- 13% ▼ -12.00%
- Reading proficiency
- 45% ▼ -2.00%
- Median HH income
- $49,019
- Composite
- 25.15/100
- National rank
- #7519
- State rank
- #361 of 517 in CA
Livability — Pine Mountain Club
- Score
- 51/100
- State rank
- #1081
- US rank
- #25334
Category grades
Schools grade is shown separately in the Schools card above.
Census & demographics
- Census place
- Pine Mountain Club, CA
- Population (ZIP)
- 2,538
Population outlook (Kern County) Hauer SSP2
- Today (2025)
- 947,286 people
- By 2030
- 978,984 · +3.3%
- By 2040
- 1,045,018 · +10.3%
- By 2050
- 1,105,232 · +16.7%
- By 2075
- 1,229,538 · +29.8%
- By 2100
- 1,238,059 · +30.7%
Race, ethnicity, and origin ACS 2023
- Neighborhood character
- Diverse neighborhood (Simpson 0.59)
- Race & ethnicity
- White 58% Hispanic / Latino 21% Asian 16% Two or more races 8% Native American 1%
- Hispanic origin (detail)
- Mexican 16% Salvadoran 1%
- Common ancestry
- Romanian 5% Lithuanian 4% Slovak 3%
- Foreign-born
- 13% · Canada, Dominican Republic, South Korea
- Languages at home
- 67% English-only · Spanish 13% Tagalog/Filipino 12% Other Indo-European 3%
Political lean MEDSL · Kern
- 2024 margin
- Strong R (+21.1) · D 38.2% · R 59.3% · Other 2.5%
- 2008→2024 swing
- -3.3pp toward R · 2008: -17.8pp · 2024: -21.1pp
- All cycles
- 2024: R+21.1 2020: R+10.2 2016: R+15.0 2012: R+20.9 2008: R+17.8
Not yet ingested
- Civics
- —
Market trends
- HPI YoY
- ▼ -0.83%
- Current HPI
- 307.7453
- Rent YoY
- —
- Metro
- —
- State GDP YoY
- ▲ 3.21%
- F500 in state
- 116
Industry mix (Fortune 500 HQ in CA)
| Industry | F500 HQs | Revenue |
|---|---|---|
| Technology | 27 | $1,492B |
|
||
| Financial Services | 3 | $174B |
|
||
| Retail | 3 | $44B |
|
||
| Insurance | 3 | $26B |
|
||
| Media / Entertainment | 2 | $115B |
|
||
| Pharmaceuticals / Biotech | 2 | $62B |
|
||
Price history
+125.2% since first listed12 events — show timeline
- 2026-04-14 Pending — TheMLS
- 2026-04-14 Relisted — TheMLS
- 2026-04-11 Price Changed $259,000 TheMLS
- 2026-01-26 Price Changed $359,000 TheMLS
- 2025-12-09 Price Changed $369,000 TheMLS
- 2025-08-20 Price Changed $499,000 TheMLS
- 2025-07-11 Listed $525,000 TheMLS
- 2022-04-06 Sold (Public Records) $475,000 Public Records
- 2011-09-29 Sold (Public Records) $158,000 Public Records
- 2003-02-28 Sold (Public Records) $190,000 Public Records
- 1996-11-01 Sold (Public Records) $83,000 Public Records
- 1980-11-26 Sold (Public Records) $115,000 Public Records
Property tax history
+10.6%/yrLatest (2025): $5,720 · +0.8% YoY. Source: county tax records.
Cash-flow waterfall
monthlySold comps — $/sqft
last 12 mo · ≤1 miLoading sold comps…