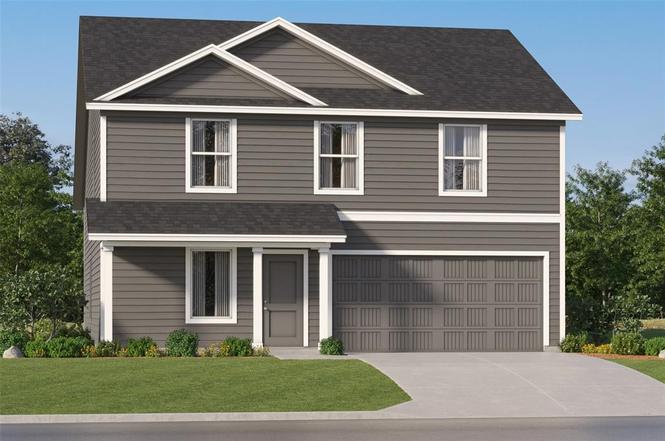
7108 Meandering Creek Ln
Fort Worth, TX 76179
$307,999D-
4 bd · 2.5 ba ·
1,891 sqft ·
Built 2025
· Other
· Pending
· 40 DOM
Cashflow @ list (25.0% down · 7.5%)
Estimated rent
$2,328/mo
Mortgage (P&I)
−$1,615
Tax + insurance
−$220
HOA
−$58
Vac / Maint / Mgmt
−$489
Net cashflow
$-54/mo
Annual
$-646/yr
Cap rate
6.08%
Cash-on-cash
-0.75%
DSCR
0.97
1% rule
0.76%
Cash to close
$86,240
Investor read
- This is a 4-bed/2.5-bath other listed at $308k.
- At list price, monthly cash flow is $-54 ($-646/yr) — negative.
- To cash-flow at today's rent, offer at most $298k (3.1% below list).
- To meet the 1% rule (rent ≥ 1% of price), the offer needs to be $233k (24.4% below list).
- It's been on market 40 days — a 3% lower offer ($299k) is reasonable based on typical stale-listing flexibility.
- Recommended offer: $233k (24.4% below list) — sets the bar for 1% rule.
- Local home prices are declining (-3.0%/yr); year-one equity from $2k of loan paydown is wiped out by about $9k of value loss. Plan a longer hold.
- Location reads 80/100 on livability (#49 in TX, #1,954 nationally) — a professional / high-income tenant draw. Strengths: amenities A+, cost of living A+, housing A+; Watch: crime F.
- Eagle Mt-Saginaw ISD (urban): math 35% / reading 42% proficiency, ranked #361 of 826 in TX (top 44%) — families likely to look elsewhere, expect single-tenant / working-renter base with shorter leases.
- Zoned schools: Bryson El (math 23% / reading 27%, grade F, #3,013 of 4,322 statewide, top 70%, 547 students, 63% FRL) — zoned schools average 63% FRL vs 36% district-wide (28 pts higher); higher-poverty schools than district average — tighter screening recommended.
- Zoned-school proficiency averages 25% at this address vs 38% district-wide (-14 pts) — the specific schools serving this property underperform the Eagle Mt-Saginaw ISD average; the district grade overstates school quality for this exact location.
- Market conditions: Rents rising (+1.5%/yr); 1050 active listings in the ZIP; 40 comparable units currently listed for rent nearby; rentals at typical pace (median 21d on market — plan ~3-4 weeks tenant-placement turnaround); solid renter incomes; 18,938 units permitted in Tarrant County in 2024 (8,336 in 5+ unit buildings).
- Tarrant County population projected at +41% by 2050 — long-run rental-demand tailwind backs the buy-and-hold thesis.
- Climate carrying-cost: major wind risk, 27% chance of damaging wind over 30y; extreme-heat days projected 6→19/yr by 2055 (HVAC capex compounding) — expect insurance premiums to compound above CPI over the hold.
- Cap rate 6.1% vs local median 3.9% in Fort Worth — top-decile yield for the area; either an underpriced asset or a hidden risk that comps aren't pricing in. Stress-test before assuming the spread holds.
Questions for listing agent
- What do current leases actually rent for vs. the listed asking? Can we see a recent rent roll and the last 12 months of T-12 income?
- It's been on market 40 days. Have you received any prior offers? Is the seller open to a 24% concession, seller financing, or rate buy-down credit?
- What does the HOA fee cover, when was the last increase, and are there any pending special assessments or reserve-fund shortfalls?
- Is there a deadline driving the sale (1031 exchange, divorce, estate, relocation)? That informs how much negotiation room exists.
- Schools are D-rated, which usually means shorter tenancies and higher turnover. Who's the typical renter profile here, and what's been the actual vacancy rate?
- Crime grade is F in this area — have there been break-ins, vandalism, or insurance claims at this property in the last 3 years? What carrier currently insures it and at what premium?
- The area grade is low — what's the realistic commute time and amenity access for the typical tenant pool here? Any planned neighborhood developments (good or bad) we should know about?
- What's the average days-on-market for RENTAL listings here right now (not sales)? A rising rental-DOM trend means longer vacancies and softer asking-rent achievability than the comps imply.
CashFlowRE · CFR-FF1ZCRD8MEE1GD
· Data 1 week ago
cashflowre.app · 2026-05-29