7108 Meandering Creek Ln · Fort Worth, TX
Flood risk 1/10 · Minimal
- FEMA flood zone
- X (unshaded)
- Chance of flooding over 30 yrs
- 0.0%
- Est. flood insurance / yr
- $507 – $1,088
Fire risk 4/10 · Minor
- Est. fire insurance / yr
- $1,222 – $2,270
Heat risk 7/10 · Major
- Hot days now (above 109°F)
- 6 days/yr
- Hot days in 30 yrs
- 19 days/yr
Wind risk 6/10 · Moderate
- Chance of severe wind over 30 yrs
- 27.0%
Air-quality risk 2/10 · Minimal
- Unhealthy air days now
- 1 days/yr
- Unhealthy air days in 30 yrs
- 2 days/yr
Risk factors via First Street. Map © Google.
Why this score? — see what drove the D- grade
The composite is a weighted blend of 9 inputs, each scored 0–100. Each bar is that input's sub-score; the figure is the points it added to the 100-point composite (weight × sub-score).
- Cash flow +12.3/30.0
- ARV discount +7.5/15.0
- Livability +4.0/5.0
- DSCR +3.7/10.0
- Schools +3.5/10.0
- Rent growth +2.9/5.0
- 1% rule +2.6/10.0
- Condition / age +2.5/5.0
- Appreciation +0.0/10.0
$307,999
🖨 Deal sheet 📄 Offer letter ✓ Due diligence
Listing remarks
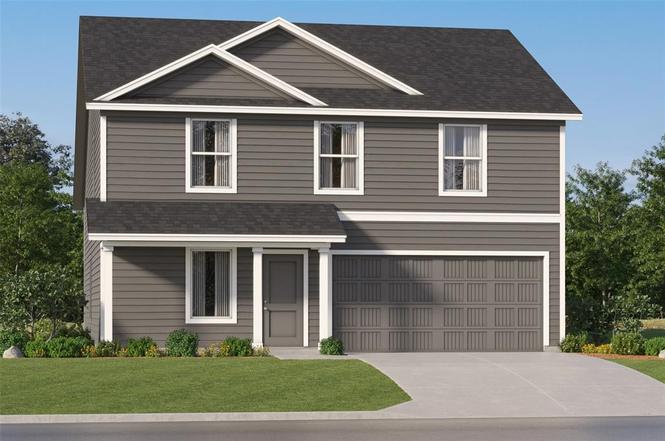
LENNAR - Landing at Creekside - On the first floor of this spacious two-story home is a convenient and modern layout seamlessly connecting the kitchen, dining room and family room together. In a private corner is the tranquil owner’s suite with an attached bathroom and walk-in closet. Upstairs is a sprawling central game room made for gatherings of all sizes, along with three secondary bedrooms to provide sleeping accommodations to family members and guests.
Key facts
- Central game room
- Attached bathroom
- Walk-in closet
Tags
Neighborhood map
What this means for you Summary
Snapshot
- This is a 4-bed/2.5-bath other listed at $308k.
Deal economics
- At list price, monthly cash flow is $-54 ($-646/yr) — negative.
- To cash-flow at today's rent, offer at most $298k (3.1% below list).
- To meet the 1% rule (rent ≥ 1% of price), the offer needs to be $233k (24.4% below list).
- Recommended offer: $233k (24.4% below list) — sets the bar for 1% rule.
- Cap rate 6.1% vs local median 3.9% in Fort Worth — top-decile yield for the area; either an underpriced asset or a hidden risk that comps aren't pricing in. Stress-test before assuming the spread holds.
Location & tenants
- Location reads 80/100 on livability (#49 in TX, #1,954 nationally) — a professional / high-income tenant draw. Strengths: amenities A+, cost of living A+, housing A+; Watch: crime F.
- Eagle Mt-Saginaw ISD (urban): math 35% / reading 42% proficiency, ranked #361 of 826 in TX (top 44%) — families likely to look elsewhere, expect single-tenant / working-renter base with shorter leases.
- Zoned schools: Bryson El (math 23% / reading 27%, grade F, #3,013 of 4,322 statewide, top 70%, 547 students, 63% FRL) — zoned schools average 63% FRL vs 36% district-wide (28 pts higher); higher-poverty schools than district average — tighter screening recommended.
- Zoned-school proficiency averages 25% at this address vs 38% district-wide (-14 pts) — the specific schools serving this property underperform the Eagle Mt-Saginaw ISD average; the district grade overstates school quality for this exact location.
- Market conditions: Rents rising (+1.5%/yr); 1050 active listings in the ZIP; 40 comparable units currently listed for rent nearby; rentals at typical pace (median 21d on market — plan ~3-4 weeks tenant-placement turnaround); solid renter incomes; 18,938 units permitted in Tarrant County in 2024 (8,336 in 5+ unit buildings).
Forward outlook
- Local home prices are declining (-3.0%/yr); year-one equity from $2k of loan paydown is wiped out by about $9k of value loss. Plan a longer hold.
- Tarrant County population projected at +41% by 2050 — long-run rental-demand tailwind backs the buy-and-hold thesis.
Negotiation context
- It's been on market 40 days — a 3% lower offer ($299k) is reasonable based on typical stale-listing flexibility.
Risks & watch-outs
- Climate carrying-cost: major wind risk, 27% chance of damaging wind over 30y; extreme-heat days projected 6→19/yr by 2055 (HVAC capex compounding) — expect insurance premiums to compound above CPI over the hold.
Questions for the listing agent
- What do current leases actually rent for vs. the listed asking? Can we see a recent rent roll and the last 12 months of T-12 income?
- It's been on market 40 days. Have you received any prior offers? Is the seller open to a 24% concession, seller financing, or rate buy-down credit?
- What does the HOA fee cover, when was the last increase, and are there any pending special assessments or reserve-fund shortfalls?
- Is there a deadline driving the sale (1031 exchange, divorce, estate, relocation)? That informs how much negotiation room exists.
- Schools are D-rated, which usually means shorter tenancies and higher turnover. Who's the typical renter profile here, and what's been the actual vacancy rate?
- Crime grade is F in this area — have there been break-ins, vandalism, or insurance claims at this property in the last 3 years? What carrier currently insures it and at what premium?
- The area grade is low — what's the realistic commute time and amenity access for the typical tenant pool here? Any planned neighborhood developments (good or bad) we should know about?
- What's the average days-on-market for RENTAL listings here right now (not sales)? A rising rental-DOM trend means longer vacancies and softer asking-rent achievability than the comps imply.
- What's the recent tenant-quality profile in this submarket — average credit score on applications, eviction rate, late-payment / NSF rate, and stable-employment percentage? A property-management company in the area should have these aggregated.
- How much new for-sale + rental construction is in the pipeline within 1–3 miles? Heavy new supply typically softens prices + rents 12–24 months out; constrained supply supports both.
Investment metrics
- 1% rule
- 0.76% ✗
- Cap rate
- 6.08%
- Cash-on-cash
- -0.75%
- DSCR
- 0.97
- GRM
- 11.0
CMA / ARV
No comps found within radius.
Projected returns pro-forma
-3.0% appreciation · 1.51% rent growth · sell at horizon
- IRR
- -19.1%
- Equity multiple
- 0.34×
- Total profit
- $-56,887
- Equity at exit
- $45,924
- IRR
- -14.7%
- Equity multiple
- 0.21×
- Total profit
- $-68,092
- Equity at exit
- $26,630
Cash invested: $86,240 (down + closing). Projections, not guarantees.
Landlord ↔ Tenant lean methodology
- Overall (STATE)
- 87 Strongly Landlord-Friendly
- State Texas
- 87 Strongly Landlord-Friendly · R+5
- County
- — inherits STATE
- City
- — inherits STATE
ZIP-level market 76179
- Rents YoY
- 1.5%
- Active inventory
- 1050
- Price-to-rent
- 11.0×
Monthly cashflow live
- Estimated rent
- $2,328 high interval (Pro) →
- Mortgage (P&I)
- −$1,615
- Tax from tax record
- −$91 /mo · $1,095/yr
- Insurance
- −$128
- HOA
- −$58
- Vacancy / Maint / Mgmt
- −$489
- Net cashflow
- $-54
Break-even live
UW: 25.0% down · 7.5% · 30yr · 1.5% tax · 5.0% vac · 8.0% maint · 8.0% mgmt
Financing live
Cash to close
- Down payment
- $77,000
- Closing costs
- $9,240
- Reserves months
- —
- Total cash needed
- —
Loan-product check · same deal, 3 products live
Conventional
25% down · 7.5% · 30yr
- Down + closing
- —
- Monthly P&I
- —
- Monthly cashflow
- —
- DSCR
- —
- Eligible?
- —
Personal DTI + credit; lowest rate.
DSCR
20% down · 8.5% · 30yr
- Down + closing
- —
- Monthly P&I
- —
- Monthly cashflow
- —
- DSCR
- —
- Eligible?
- —
No personal income docs; deal must DSCR.
Hard money
10% down · 12.0% · 12mo
- Down + closing
- —
- Monthly P&I
- —
- Monthly cashflow
- —
- DSCR
- —
- Eligible?
- —
Short-term bridge; refi at stabilization.
Rent comps 40 comps
| Address | Beds | Baths | Sqft | Rent | $/sqft | DOM | Units | Dist |
|---|---|---|---|---|---|---|---|---|
| 4900 Old Ember Ln Fort Worth, TX | 3.0 | 2.0 | 1260 | $1,500 | $1.19 | 7d | 1 | 0.27mi |
| 4964 Creek Ridge Trl Fort Worth, TX | 3.0 | 2.5 | 2177 | $2,140 | $0.98 | 21d | 1 | 0.36mi |
| 6848 Valley Creek Dr Fort Worth, TX | 3.0 | 2.0 | 1537 | $1,975 | $1.28 | 24d | 1 | 0.36mi |
| 4725 Harlequin Dr Fort Worth, TX | 3.0 | 2.0 | 1636 | $2,250 | $1.38 | 4d | 1 | 0.41mi |
| 8249 Muscovy Dr Fort Worth, TX | 4.0 | 2.5 | 2095 | $2,599 | $1.24 | 15d | 1 | 0.41mi |
| 8261 Bufflehead Dr Fort Worth, TX | 4.0 | 2.0 | 1883 | $2,295 | $1.22 | 24d | 1 | 0.43mi |
| 6812 Valley Creek Dr Fort Worth, TX | 4.0 | 2.0 | 1764 | $1,950 | $1.11 | 20d | 1 | 0.44mi |
| 4705 Harlequin Dr Fort Worth, TX | 4.0 | 2.0 | 1721 | $2,300 | $1.34 | 24d | 1 | 0.45mi |
| 6933 Meadow Way Ln Fort Worth, TX | 4.0 | 2.5 | 1942 | $1,955 | $1.01 | 20d | 1 | 0.48mi |
| 6933 Meadow Way Ln Fort Worth, TX | 4.0 | 2.5 | 1942 | $2,021 | $1.04 | 21d | 1 | 0.48mi |
| 4900 Bass Dr Fort Worth, TX | 4.0 | 3.0 | 1910 | $2,700 | $1.41 | 20d | 1 | 0.49mi |
| 6824 Turtle Stream Dr Fort Worth, TX | 3.0 | 2.0 | 1575 | $1,965 | $1.25 | 5d | 1 | 0.49mi |
| 5344 Brahma Trl Fort Worth, TX | 3.0 | 2.0 | 1720 | $2,195 | $1.28 | 7d | 1 | 0.53mi |
| 5344 Brahma Trl Fort Worth, TX | 3.0 | 2.0 | 1720 | $2,295 | $1.33 | 24d | 1 | 0.53mi |
| 4545 Waterford Dr Fort Worth, TX | 4.0 | 2.5 | 1960 | $2,086 | $1.06 | 12d | 1 | 0.57mi |
| 8205 Buck Mountain Pass Fort Worth, TX | 3.0 | 2.0 | 1316 | $1,995 | $1.52 | 12d | 1 | 0.58mi |
| 5100 Waterford Dr Fort Worth, TX | 3.0 | 2.5 | 1848 | $1,850 | $1.00 | 24d | 1 | 0.59mi |
| 6701 Meadow Way Ln Fort Worth, TX | 4.0 | 2.0 | 1532 | $1,950 | $1.27 | 21d | 1 | 0.59mi |
| 5008 Waterford Dr Fort Worth, TX | 4.0 | 2.5 | 1972 | $2,100 | $1.06 | 3d | 1 | 0.60mi |
| 5008 Waterford Dr Fort Worth, TX | 4.0 | 2.5 | 1972 | $2,100 | $1.06 | 24d | 1 | 0.60mi |
| 8204 Buck Mountain Pass Fort Worth, TX | 3.0 | 2.0 | 1638 | $2,100 | $1.28 | 2d | 1 | 0.60mi |
| 8348 Hawkview Dr Fort Worth, TX | 4.0 | 2.5 | 2121 | $3,000 | $1.41 | 12d | 1 | 0.62mi |
| 4937 Waterford Dr Fort Worth, TX | 3.0 | 2.5 | 1810 | $1,879 | $1.04 | 24d | 1 | 0.63mi |
| 6521 Trident Ct Fort Worth, TX | 4.0 | 2.0 | 1802 | $2,095 | $1.16 | 16d | 1 | 0.65mi |
| 5824 Heatherglen Ter Fort Worth, TX | 3.0 | 2.0 | 1297 | $1,865 | $1.44 | 5d | 1 | 0.70mi |
| 8408 Buck Mountain Pass Fort Worth, TX | 4.0 | 2.5 | 2131 | $2,375 | $1.11 | 24d | 1 | 0.71mi |
| 8405 Three Bars Dr Fort Worth, TX | 3.0 | 2.5 | 2372 | $2,400 | $1.01 | 3d | 1 | 0.72mi |
| 8453 Shallow Creek Dr Fort Worth, TX | 3.0 | 2.5 | 1947 | $2,195 | $1.13 | 7d | 1 | 0.73mi |
| 8453 Shallow Creek Dr Fort Worth, TX | 3.0 | 3.0 | 1947 | $2,195 | $1.13 | 24d | 1 | 0.73mi |
| 8440 Shallow Creek Dr Fort Worth, TX | 4.0 | 2.5 | 2260 | $2,700 | $1.19 | 21d | 1 | 0.74mi |
| 732 Fox Run Trl Saginaw, TX | 4.0 | 2.5 | 2336 | $2,295 | $0.98 | 20d | 1 | 0.75mi |
| 6612 Waterhill Ln Fort Worth, TX | 3.0 | 2.5 | 1842 | $1,995 | $1.08 | 12d | 1 | 0.75mi |
| 5612 Northfield Dr Fort Worth, TX | 3.0 | 2.0 | 1336 | $2,083 | $1.56 | 12d | 1 | 0.76mi |
| 5725 Northfield Dr Fort Worth, TX | 3.0 | 2.0 | 1275 | $1,860 | $1.46 | 20d | 1 | 0.77mi |
| 4536 Skipador Dr Fort Worth, TX | 3.0 | 2.0 | 1236 | $2,000 | $1.62 | 3d | 1 | 0.79mi |
| 725 Gray Wash Dr Unit Labs Fort Worth, TX | 3.0 | 2.0 | 1888 | $2,100 | $1.11 | 24d | 1 | 0.79mi |
| 5800 Stone Meadow Ln Fort Worth, TX | 3.0 | 2.0 | 1574 | $1,925 | $1.22 | 24d | 1 | 0.79mi |
| 5716 Stone Meadow Ln Fort Worth, TX | 3.0 | 2.0 | 1356 | $2,135 | $1.57 | 24d | 1 | 0.80mi |
| 5816 Stone Meadow Ln Fort Worth, TX | 3.0 | 2.0 | 1608 | $2,095 | $1.30 | 24d | 1 | 0.81mi |
| 7656 Northumberland Dr Fort Worth, TX | 3.0 | 2.0 | 2007 | $2,325 | $1.16 | 21d | 1 | 0.81mi |
HOA detail
- Monthly dues
- $58 · $696/yr
Listing history 5 events
-
2026-04-19status Pending
-
2026-04-14price $307,999
-
2026-04-06price $305,999
-
2026-04-04price $308,999
-
2026-03-10$309,999 Active
ⓘ Source: listings_history table (triggers on properties + properties_extension) + one-shot
backfill from property_details.listing_events for pre-trigger history.
Tax reassessment forecast TX · Resets to sale price
- Current annual tax
- $1,095 · $91/mo
- Projected year-2 tax
- $5,636 · $470/mo
- Expected delta
- +$4,542/yr (+$378/mo · 414.9%)
ⓘ Screening estimate from a state-policy table — verify with the county assessor before closing.
Climate risk First Street
- Flood 1/10 Low FEMA zone X (unshaded) · 0% chance over 30 yrs
- Wildfire 4/10 Moderate
- Heat 7/10 Severe 6 d/yr ≥109°F today · 19 d/yr by 30 yrs out
- Wind 6/10 Major 27% chance of damaging wind over 30 yrs
- Air quality 2/10 Low 1 unhealthy d/yr today · 2 by 30 yrs out
Nearby sold comps map
Loading sold comps map…
Walkable amenities ~0.75 mi
Loading nearby amenities…
Taxation est. · year 1
- Rental income
- $27,932
- − Mortgage interest
- −$17,253
- − Property taxes
- −$1,095
- − Insurance
- −$1,540
- − Repairs & maintenance
- −$2,235
- − Management
- −$2,235
- − HOA
- −$696
- − Depreciation
- −$8,960
- Taxable loss
- −$6,080
- Est. tax savings @ 24.0%
- +$1,459
- After-tax cash flow
- $813/yr
For passive investors: Depreciation is non-cash, so a rental often shows a tax loss while cash-flowing — sheltering income. Rental losses are passive: they offset passive income freely, and up to $25,000/yr can offset ordinary (W-2) income if you actively participate and your MAGI is under $100k (phasing out to $0 by $150k); unused losses carry forward. On sale, claimed depreciation is recaptured at up to 25%, and gains may owe capital-gains tax (a 1031 exchange can defer both). Figures are a year-1 estimate at your 24.0% rate — not tax advice; consult a CPA.
Schools (NCES district)
- District
- Eagle Mt-Saginaw ISD
- NCES district ID
- 4817700
- Math proficiency
- 35% ▼ -16.00%
- Reading proficiency
- 42% ▼ -9.00%
- Median HH income
- $72,781
- Composite
- 35.41/100
- National rank
- #4945
- State rank
- #361 of 826 in TX
Livability — Fort Worth
- Score
- 80/100
- State rank
- #49
- US rank
- #1954
Category grades
Schools grade is shown separately in the Schools card above.
Census & demographics
- Census place
- Fort Worth, TX
- County
- Tarrant County · 2,033,669 people
- City population
- 911,619
- Metro
- Dallas-Fort Worth-Arlington, TX
- Population (ZIP)
- 80,090
- Household income
- $107,428
- Rent vs Own
- Severe rent burden
- 1494.0
Population outlook (Tarrant County) Hauer SSP2
- Today (2025)
- 2,380,417 people
- By 2030
- 2,578,900 · +8.3%
- By 2040
- 2,974,995 · +25.0%
- By 2050
- 3,350,489 · +40.8%
- By 2075
- 4,216,909 · +77.2%
- By 2100
- 4,741,527 · +99.2%
Race, ethnicity, and origin ACS 2023
- Neighborhood character
- Diverse neighborhood (Simpson 0.63)
- Race & ethnicity
- White 53% Hispanic / Latino 28% Two or more races 14% Black 12% Asian 4%
- Hispanic origin (detail)
- Mexican 22% Puerto Rican 2%
- Common ancestry
- Slovak 2% Lithuanian 2% Italian 1%
- Foreign-born
- 8% · Canada, Jamaica
- Languages at home
- 81% English-only · Spanish 15% Other Asian/Pacific 2% Other Indo-European 1%
Political lean MEDSL · Tarrant
- 2024 margin
- Lean R (+5.1) · D 46.7% · R 51.9% · Other 1.4%
- 2008→2024 swing
- +6.6pp toward D · 2008: -11.7pp · 2024: -5.1pp
- All cycles
- 2024: R+5.1 2020: D+0.2 2016: R+8.7 2012: R+15.7 2008: R+11.7
Not yet ingested
- Civics
- —
Market trends
- HPI YoY
- ▼ -137.12%
- Current HPI
- 237.6676
- Rent YoY
- ▲ 1.51%
- Metro
- Dallas-Fort Worth-Arlington, TX
- State GDP YoY
- ▲ 3.95%
- F500 in state
- 110
Industry mix (Fortune 500 HQ in TX)
| Industry | F500 HQs | Revenue |
|---|---|---|
| Energy | 16 | $1,198B |
|
||
| Technology | 5 | $198B |
|
||
| Engineering / Construction | 4 | $72B |
|
||
| Energy Services | 3 | $60B |
|
||
| Utilities | 3 | $41B |
|
||
| Healthcare | 2 | $330B |
|
||
Price history
-0.6% since first listed5 events — show timeline
- 2026-04-19 Pending — NTREIS
- 2026-04-14 Price Changed $307,999 NTREIS
- 2026-04-06 Price Changed $305,999 NTREIS
- 2026-04-04 Price Changed $308,999 NTREIS
- 2026-03-10 Listed $309,999 NTREIS
Cash-flow waterfall
monthlySold comps — $/sqft
last 12 mo · ≤1 miLoading sold comps…