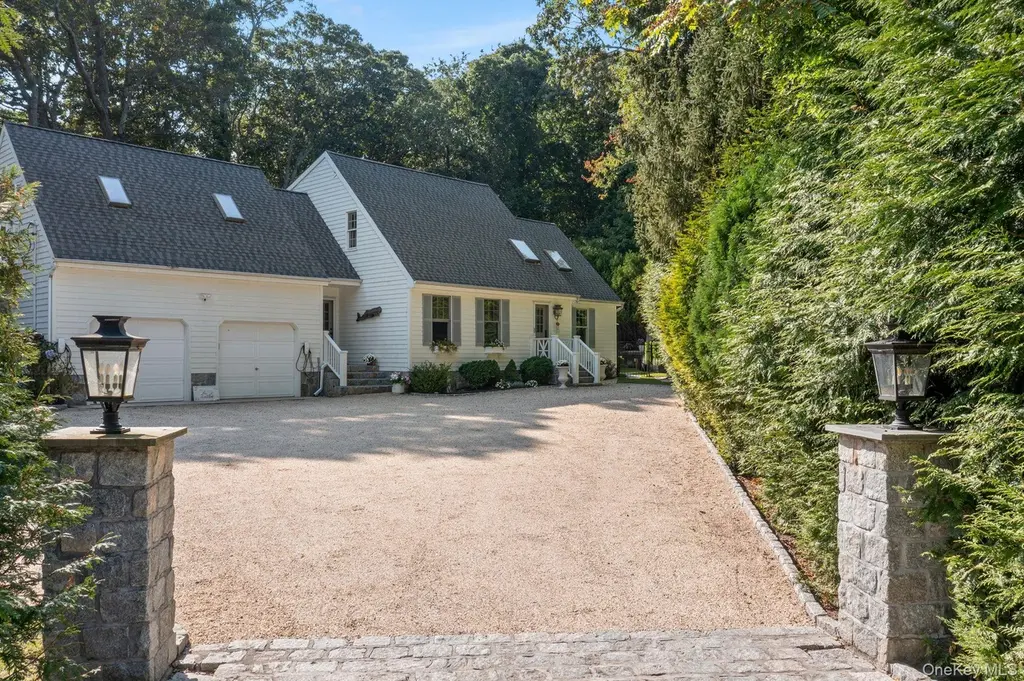
2421 Noyac Rd
Noyack, NY 11963
$1,800,000A-
3 bd · 2.0 ba ·
2,177 sqft ·
Built 2002
· SingleFamily
· Pending
· 1 DOM
Cashflow @ list (25.0% down · 7.5%)
Estimated rent
$23,319/mo
Mortgage (P&I)
−$9,439
Tax + insurance
−$1,244
HOA
−$0
Vac / Maint / Mgmt
−$4,897
Net cashflow
$7,739/mo
Annual
$92,869/yr
Cap rate
11.49%
Cash-on-cash
18.56%
DSCR
1.83
1% rule
1.30%
Cash to close
$504,000
Investor read
- This is a 3-bed/2.0-bath single-family listed at $1.80M.
- At list price, monthly cash flow is $8k ($93k/yr) — positive.
- The deal already cash-flows at list — no discount required.
- Meets the 1% rule at list price ($23k rent vs $1.80M).
- Only 1 days on market — expect competitive offers; lowballing is unlikely to land.
- In year one you build about $178k of equity ($12k loan paydown + $165k appreciation (9.2% local appreciation)).
- Location reads 57/100 on livability (#1,084 in NY) — a working-class tenant base; expect higher turnover. Strengths: crime A+, employment A+; Watch: housing D+, amenities F, commute F.
- Sag Harbor Union Free School District (suburban): math 54% / reading 70% proficiency, ranked #175 of 590 in NY (top 30%) — acceptable for families but not a draw, mixed tenant base, ~2y average lease; only 8% free/reduced lunch — higher-income household profile.
- Zoned schools: Sag Harbor Elementary School (math 47% / reading 72%, grade B-, #745 of 2,108 statewide, top 39%, 426 students, 22% FRL); Pierson Middle/High School (math 61% / reading 72%, grade B, #763 of 1,100 statewide, top 69%, 525 students, 25% FRL) — zoned schools average 24% FRL vs 8% district-wide (16 pts higher); higher-poverty schools than district average — tighter screening recommended.
- Watch-outs: flood insurance adds $56/mo.
- Market conditions: Rents rising fast (+10.8%/yr); 65 active listings in the ZIP; 4 comparable units currently listed for rent nearby; rentals at typical pace (median 22d on market — plan ~3-4 weeks tenant-placement turnaround); high-income renter base; 1,366 units permitted in Suffolk County in 2024 (216 in 5+ unit buildings).
- Suffolk County population projected to shrink 5% by 2050 — rents likely to lag national; underwrite the cash flow, not the appreciation.
- 6 sale attempts since 8y ago with the ask held roughly flat each time — persistent listings suggest the price (not the market) is what's stuck; bring a comps-based counter.
- Current owner paid $512k; list at $1.80M implies a 252% gain — meaningful room to come down on a strong offer.
- At projected returns (9.2% appreciation + 8.0% rent growth), your $504k cash investment doubles in ~2 years — after that, you're playing with house money.
- By year 2, paydown + projected appreciation supports a ~$285k cash-out refi (75% LTV) — recoverable capital for the next deal without selling this one.
- Climate carrying-cost: severe flood risk; severe wind risk, 80% chance of damaging wind over 30y — expect insurance premiums to compound above CPI over the hold.
- Cap rate 11.5% vs local median 7.1% in Noyack — top-decile yield for the area; either an underpriced asset or a hidden risk that comps aren't pricing in. Stress-test before assuming the spread holds.
Questions for listing agent
- What's the actual annual flood-insurance premium (NFIP or private), and is the property in a SFHA with mandatory coverage?
- Is there a deadline driving the sale (1031 exchange, divorce, estate, relocation)? That informs how much negotiation room exists.
- What's the average days-on-market for RENTAL listings here right now (not sales)? A rising rental-DOM trend means longer vacancies and softer asking-rent achievability than the comps imply.
- What's the recent tenant-quality profile in this submarket — average credit score on applications, eviction rate, late-payment / NSF rate, and stable-employment percentage? A property-management company in the area should have these aggregated.
- How much new for-sale + rental construction is in the pipeline within 1–3 miles? Heavy new supply typically softens prices + rents 12–24 months out; constrained supply supports both.
CashFlowRE · CFR-FFKKX03TMASE2Q
· Data 3 weeks ago
cashflowre.app · 2026-05-29