2421 Noyac Rd · Noyack, NY
Flood risk 9/10 · Severe
- FEMA flood zone
- X (unshaded)
- Chance of flooding over 30 yrs
- 0.99%
- Est. flood insurance / yr
- $473 – $860
Fire risk 3/10 · Minor
- Est. fire insurance / yr
- $691 – $1,283
Heat risk 4/10 · Minor
- Hot days now (above 90°F)
- 7 days/yr
- Hot days in 30 yrs
- 19 days/yr
Wind risk 8/10 · Major
- Chance of severe wind over 30 yrs
- 80.0%
Air-quality risk 3/10 · Minor
- Unhealthy air days now
- 2 days/yr
- Unhealthy air days in 30 yrs
- 3 days/yr
Risk factors via First Street. Map © Google.
Why this score? — see what drove the A- grade
The composite is a weighted blend of 9 inputs, each scored 0–100. Each bar is that input's sub-score; the figure is the points it added to the 100-point composite (weight × sub-score).
- Cash flow +30.0/30.0
- DSCR +10.0/10.0
- Appreciation +9.6/10.0
- ARV discount +8.9/15.0
- 1% rule +8.0/10.0
- Schools +5.6/10.0
- Rent growth +5.0/5.0
- Livability +2.9/5.0
- Condition / age +2.5/5.0
$1,800,000
🖨 Deal sheet 📄 Offer letter ✓ Due diligence
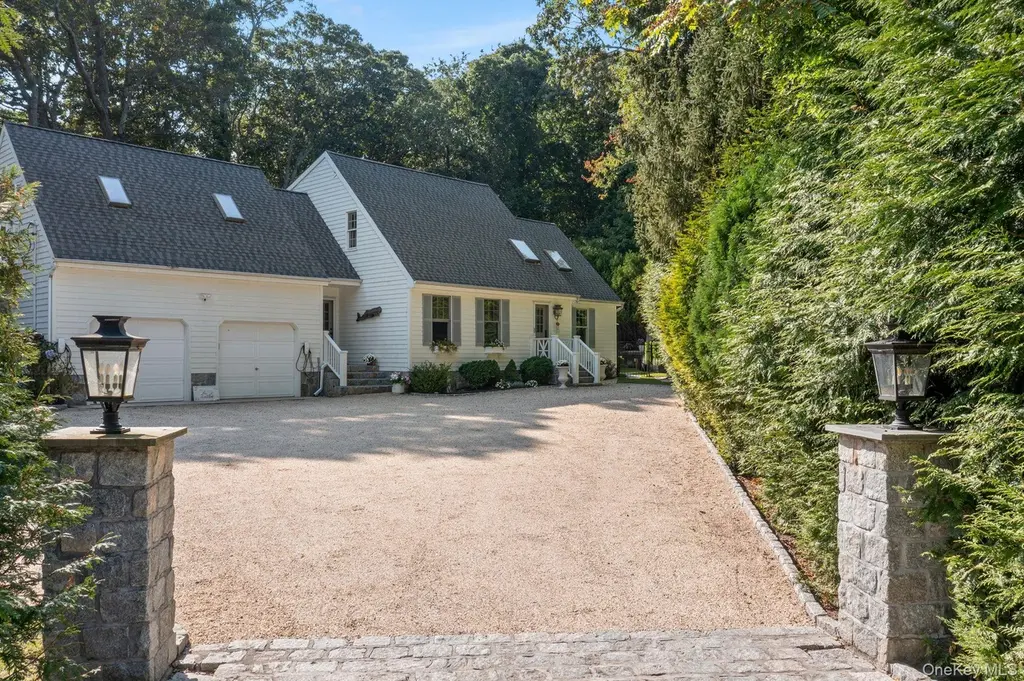
Listing remarks
Decorator’s Own! Welcome to this beautiful Expanded Ranch, where modern elegance meets classic Hamptons charm. Situated just outside the vibrant Sag Harbor Village, this residence offers a serene escape with a brand new heated gunite pool and access to a private beach association in the exclusive Sunset Shores community. This property features an inviting first-floor Primary suite complete with an updated bath and custom walk-in closet. The first floor also features a powder room and laundry area, spacious living room, and a bright eat-in kitchen featuring marble counters, center island with breakfast bar, and Sub-Zero refrigerator. Flowing seamlessly to the separate dining area, glas
Key facts
- Updated bath
- Heated gunite pool
- 0.43 acre lot
Tags
Property features AI
Exterior
- Parking: Attached private driveway; Garage with door opener; 2-car garage
- Security: Security system
- Utilities: Cesspool sewer; Cable available
- Home design: Single family residence
- Construction: Frame construction with cedar shake siding
- Exterior features: Private setting; Near shops; Mailbox; Gas grill; Patio; Private in-ground pool
Interior
- Kitchen: Cooktop; Oven; Microwave; Dishwasher; Refrigerator; Granite counters; Eat-in layout; ENERGY STAR qualified appliances
- Bedrooms: Primary suite on main level
- Flooring: Hardwood floors
- Bathrooms: 3 full bathrooms; 1 half bathroom
- Heating & cooling: Oil heating; Baseboard heating; Hot water heating; Central air conditioning
- Interior features: Cathedral ceilings; Eat-in kitchen; Granite counters; Marble counters; Primary bathroom; Chandelier; Skylights; Blinds and screens; Insulated and storm windows; Patio
- Laundry & utility: Washer; Dryer; Electric water heater
Neighborhood map
What this means for you Summary
Snapshot
- This is a 3-bed/2.0-bath single-family listed at $1.80M.
Deal economics
- At list price, monthly cash flow is $8k ($93k/yr) — positive.
- The deal already cash-flows at list — no discount required.
- Meets the 1% rule at list price ($23k rent vs $1.80M).
- Cap rate 11.5% vs local median 7.1% in Noyack — top-decile yield for the area; either an underpriced asset or a hidden risk that comps aren't pricing in. Stress-test before assuming the spread holds.
Location & tenants
- Location reads 57/100 on livability (#1,084 in NY) — a working-class tenant base; expect higher turnover. Strengths: crime A+, employment A+; Watch: housing D+, amenities F, commute F.
- Sag Harbor Union Free School District (suburban): math 54% / reading 70% proficiency, ranked #175 of 590 in NY (top 30%) — acceptable for families but not a draw, mixed tenant base, ~2y average lease; only 8% free/reduced lunch — higher-income household profile.
- Zoned schools: Sag Harbor Elementary School (math 47% / reading 72%, grade B-, #745 of 2,108 statewide, top 39%, 426 students, 22% FRL); Pierson Middle/High School (math 61% / reading 72%, grade B, #763 of 1,100 statewide, top 69%, 525 students, 25% FRL) — zoned schools average 24% FRL vs 8% district-wide (16 pts higher); higher-poverty schools than district average — tighter screening recommended.
- Market conditions: Rents rising fast (+10.8%/yr); 65 active listings in the ZIP; 4 comparable units currently listed for rent nearby; rentals at typical pace (median 22d on market — plan ~3-4 weeks tenant-placement turnaround); high-income renter base; 1,366 units permitted in Suffolk County in 2024 (216 in 5+ unit buildings).
Forward outlook
- In year one you build about $178k of equity ($12k loan paydown + $165k appreciation (9.2% local appreciation)).
- Suffolk County population projected to shrink 5% by 2050 — rents likely to lag national; underwrite the cash flow, not the appreciation.
- At projected returns (9.2% appreciation + 8.0% rent growth), your $504k cash investment doubles in ~2 years — after that, you're playing with house money.
- By year 2, paydown + projected appreciation supports a ~$285k cash-out refi (75% LTV) — recoverable capital for the next deal without selling this one.
Negotiation context
- Only 1 days on market — expect competitive offers; lowballing is unlikely to land.
- 6 sale attempts since 8y ago with the ask held roughly flat each time — persistent listings suggest the price (not the market) is what's stuck; bring a comps-based counter.
- Current owner paid $512k; list at $1.80M implies a 252% gain — meaningful room to come down on a strong offer.
Risks & watch-outs
- Watch-outs: flood insurance adds $56/mo.
- Climate carrying-cost: severe flood risk; severe wind risk, 80% chance of damaging wind over 30y — expect insurance premiums to compound above CPI over the hold.
Questions for the listing agent
- What's the actual annual flood-insurance premium (NFIP or private), and is the property in a SFHA with mandatory coverage?
- Is there a deadline driving the sale (1031 exchange, divorce, estate, relocation)? That informs how much negotiation room exists.
- What's the average days-on-market for RENTAL listings here right now (not sales)? A rising rental-DOM trend means longer vacancies and softer asking-rent achievability than the comps imply.
- What's the recent tenant-quality profile in this submarket — average credit score on applications, eviction rate, late-payment / NSF rate, and stable-employment percentage? A property-management company in the area should have these aggregated.
- How much new for-sale + rental construction is in the pipeline within 1–3 miles? Heavy new supply typically softens prices + rents 12–24 months out; constrained supply supports both.
Investment metrics
- 1% rule
- 1.30% ✓
- Cap rate
- 11.49%
- Cash-on-cash
- 18.56%
- DSCR
- 1.83
- GRM
- 6.4
CMA / ARV
- ARV (on-the-fly)
- $1,859,158
- Comps found
- 5
Show comp detail 5 sales within ~0.75 mi
| Address | Dist | Beds/Ba | Sqft | Sold | Price | $/sf | Match |
|---|---|---|---|---|---|---|---|
| 2421 Noyac Rd | 0.00mi | 4/3.5 (+1) | 2,400 (+10%) | 1mo | $1,800,000 | $750 | 71 |
| 24 Shadyrest Dr | 0.13mi | 4/3.0 (+1) | 1,932 (-11%) | 3mo | $2,225,000 | $1,152 | 64 |
| 2885 Deerfield Rd | 0.21mi | 4/3.0 (+1) | 1,904 (-12%) | 4mo | $1,626,000 | $854 | 57 |
| 65 Wildwood Rd | 0.51mi | 3/3.5 | 2,020 (-7%) | 9mo | $1,500,000 | $743 | 50 |
| 2803 Noyac Rd | 0.69mi | 2/2.5 (-1) | 1,852 (-15%) | 2mo | $1,901,000 | $1,026 | 34 |
Match score weights: distance 35% · size 25% · config 20% · recency 20%. Top-matched comps best support the ARV.
Projected returns pro-forma
9.19% appreciation · 8.0% rent growth · sell at horizon
- IRR
- 39.0%
- Equity multiple
- 3.97×
- Total profit
- $1,496,421
- Equity at exit
- $1,515,924
- IRR
- 35.9%
- Equity multiple
- 9.53×
- Total profit
- $4,301,348
- Equity at exit
- $3,162,878
Cash invested: $504,000 (down + closing). Projections, not guarantees.
Landlord ↔ Tenant lean methodology
- Overall (STATE)
- 15 Strongly Tenant-Friendly
- State New York
- 15 Strongly Tenant-Friendly · D+10
- County
- — inherits STATE
- City
- — inherits STATE
ZIP-level market 11963
- Home prices YoY
- 1.9%
- Rents YoY
- 10.8%
- Active inventory
- 65
- Price-to-rent
- 6.4×
Monthly cashflow live
- Estimated rent
- $23,319 medium interval (Pro) →
- Mortgage (P&I)
- −$9,439
- Tax from tax record
- −$438 /mo · $5,256/yr
- Insurance
- −$750
- Flood insurance flood zone
- −$56 /mo · $666/yr
- HOA
- −$0
- Vacancy / Maint / Mgmt
- −$4,897
- Net cashflow
- $7,739
Break-even live
UW: 25.0% down · 7.5% · 30yr · 1.5% tax · 5.0% vac · 8.0% maint · 8.0% mgmt
Financing live
Cash to close
- Down payment
- $450,000
- Closing costs
- $54,000
- Reserves months
- —
- Total cash needed
- —
Loan-product check · same deal, 3 products live
Conventional
25% down · 7.5% · 30yr
- Down + closing
- —
- Monthly P&I
- —
- Monthly cashflow
- —
- DSCR
- —
- Eligible?
- —
Personal DTI + credit; lowest rate.
DSCR
20% down · 8.5% · 30yr
- Down + closing
- —
- Monthly P&I
- —
- Monthly cashflow
- —
- DSCR
- —
- Eligible?
- —
No personal income docs; deal must DSCR.
Hard money
10% down · 12.0% · 12mo
- Down + closing
- —
- Monthly P&I
- —
- Monthly cashflow
- —
- DSCR
- —
- Eligible?
- —
Short-term bridge; refi at stabilization.
Rent comps 4 comps
| Address | Beds | Baths | Sqft | Rent | $/sqft | DOM | Units | Dist |
|---|---|---|---|---|---|---|---|---|
| 2723 Deerfield Rd Sag Harbor, NY | 3.0 | 2.5 | 2000 | $15,000 | $7.50 | 43d | 1 | 0.43mi |
| 112 Laurel Valley Dr Sag Harbor, NY | 4.0 | 3.0 | 2400 | $20,000 | $8.33 | 1d | 1 | 1.05mi |
| 18 Bay View Rd Southampton, NY | 3.0 | 3.0 | 2600 | $50,000 | $19.23 | 22d | 1 | 1.25mi |
| 1646 Noyack Rd Southampton, NY | 4.0 | 3.0 | 2458 | $40,000 | $16.27 | 22d | 1 | 1.44mi |
Tax reassessment forecast NY · Partial reset (capped growth)
- Current annual tax
- $5,256 · $438/mo
- Projected year-2 tax
- $17,838 · $1,487/mo
- Expected delta
- +$12,582/yr (+$1,048/mo · 239.4%)
ⓘ Screening estimate from a state-policy table — verify with the county assessor before closing.
Climate risk First Street
- Flood 9/10 Extreme FEMA zone X (unshaded) · 99% chance over 30 yrs
- Wildfire 3/10 Moderate
- Heat 4/10 Moderate 7 d/yr ≥90°F today · 19 d/yr by 30 yrs out
- Wind 8/10 Severe 80% chance of damaging wind over 30 yrs
- Air quality 3/10 Moderate 2 unhealthy d/yr today · 3 by 30 yrs out
Nearby sold comps map
Loading sold comps map…
Walkable amenities ~0.75 mi
Loading nearby amenities…
Taxation est. · year 1
- Rental income
- $279,828
- − Mortgage interest
- −$100,828
- − Property taxes
- −$5,256
- − Insurance
- −$9,666
- − Repairs & maintenance
- −$22,386
- − Management
- −$22,386
- − Depreciation
- −$52,364
- Taxable income
- $66,941
- Est. tax owed @ 24.0%
- −$16,066
- After-tax cash flow
- $76,803/yr
For passive investors: Depreciation is non-cash, so a rental often shows a tax loss while cash-flowing — sheltering income. Rental losses are passive: they offset passive income freely, and up to $25,000/yr can offset ordinary (W-2) income if you actively participate and your MAGI is under $100k (phasing out to $0 by $150k); unused losses carry forward. On sale, claimed depreciation is recaptured at up to 25%, and gains may owe capital-gains tax (a 1031 exchange can defer both). Figures are a year-1 estimate at your 24.0% rate — not tax advice; consult a CPA.
Schools (NCES district)
- District
- Sag Harbor Union Free School District
- NCES district ID
- 3625380
- Math proficiency
- 54% ▼ -13.00%
- Reading proficiency
- 70% ▲ 7.00%
- Median HH income
- $81,547
- Composite
- 55.69/100
- National rank
- #1222
- State rank
- #175 of 590 in NY
Livability — Noyack
- Score
- 57/100
- State rank
- #1084
- US rank
- #21915
Category grades
Schools grade is shown separately in the Schools card above.
Census & demographics
- Census place
- Noyack, NY
- County
- Suffolk County · 679,920 people
- City population
- 8,114
- Metro
- New York-Newark-Jersey City, NY-NJ-PA
- Population (ZIP)
- 8,390
- Household income
- $127,746
- Rent vs Own
- Severe rent burden
- 95.0
Population outlook (Suffolk County) Hauer SSP2
- Today (2025)
- 1,505,262 people
- By 2030
- 1,498,318 · -0.5%
- By 2040
- 1,471,101 · -2.3%
- By 2050
- 1,424,848 · -5.3%
- By 2075
- 1,337,157 · -11.2%
- By 2100
- 1,217,720 · -19.1%
Race, ethnicity, and origin ACS 2023
- Neighborhood character
- Predominantly White (78%)
- Race & ethnicity
- White 78% Hispanic / Latino 13% Two or more races 11% Asian 4% Black 2%
- Hispanic origin (detail)
- Mexican 8%
- Common ancestry
- Scotch-Irish 4% Romanian 3% Italian 2%
- Foreign-born
- 13% · Canada, China, Jamaica
- Languages at home
- 81% English-only · Spanish 9% Other Indo-European 5% French/Haitian/Cajun 2%
Political lean MEDSL · Suffolk
- 2024 margin
- Lean R (+10.0) · D 45.0% · R 55.0%
- 2008→2024 swing
- -16.0pp toward R · 2008: 6.0pp · 2024: -10.0pp
- All cycles
- 2024: R+10.0 2020: R+0.0 2016: R+8.2 2012: D+2.9 2008: D+6.0
Not yet ingested
- Civics
- —
Market trends
- HPI YoY
- ▲ 9.19%
- Current HPI
- 499.3304
- Rent YoY
- ▲ 10.76%
- Metro
- New York-Newark-Jersey City, NY-NJ-PA
- State GDP YoY
- ▲ 2.60%
- F500 in state
- 92
Industry mix (Fortune 500 HQ in NY)
| Industry | F500 HQs | Revenue |
|---|---|---|
| Financial Services | 10 | $950B |
|
||
| Consumer Goods | 9 | $162B |
|
||
| Insurance | 4 | $225B |
|
||
| Telecommunications | 2 | $144B |
|
||
| Pharmaceuticals | 2 | $112B |
|
||
| Media / Entertainment | 2 | $69B |
|
||
Price history
+181.2% since first listed15 events — show timeline
- 2026-05-28 Pending — OneKey® MLS as Distributed by MLS Grid
- 2026-05-27 Listed $1,800,000 OneKey® MLS as Distributed by MLS Grid
- 2026-03-25 Listing Removed — OneKey® MLS as Distributed by MLS Grid
- 2025-10-14 Price Changed $1,849,000 OneKey® MLS as Distributed by MLS Grid
- 2025-09-02 Listed $1,900,000 OneKey® MLS as Distributed by MLS Grid
- 2024-09-27 Price Changed $1,650,000 OneKey® MLS as Distributed by MLS Grid
- 2024-07-18 Listed $1,750,000 OneKey® MLS as Distributed by MLS Grid
- 2019-08-28 Sold (MLS) $512,000 OneKey® MLS as Distributed by MLS Grid
- 2019-07-24 Pending — OneKey® MLS as Distributed by MLS Grid
- 2019-07-02 Listed $508,200 OneKey® MLS as Distributed by MLS Grid
- 2019-05-20 Listing Removed — OneKey® MLS as Distributed by MLS Grid
- 2019-03-21 Listed $629,000 OneKey® MLS as Distributed by MLS Grid
- 2018-10-20 Listing Removed — OneKey® MLS as Distributed by MLS Grid
- 2018-07-23 Listed $649,000 OneKey® MLS as Distributed by MLS Grid
- 2005-10-25 Sold (Public Records) $640,000 Public Records
Property tax history
+1.1%/yrLatest (2024): $5,256 · +0.0% YoY. Source: county tax records.
Cash-flow waterfall
monthlySold comps — $/sqft
last 12 mo · ≤1 miLoading sold comps…