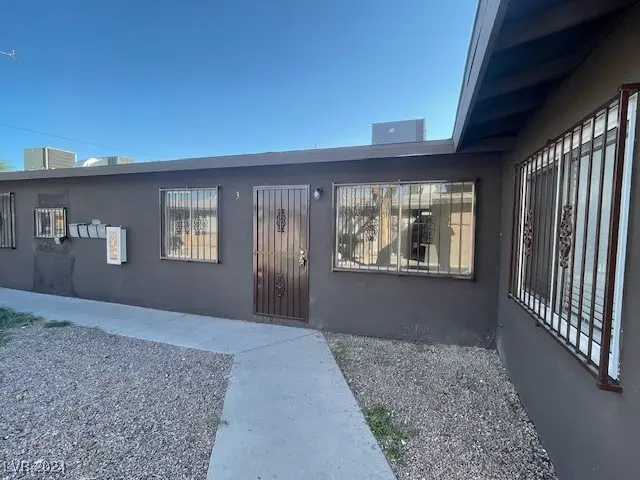
2504 E Mesquite Ave
Las Vegas, NV 89101
$610,000D-
6 bd · 4.0 ba ·
2,870 sqft ·
Built 1963
· MultiFamily
· Active
· 27 DOM
Cashflow @ list (25.0% down · 7.5%)
Estimated rent
$4,156/mo
Mortgage (P&I)
−$3,199
Tax + insurance
−$393
HOA
−$0
Vac / Maint / Mgmt
−$873
Net cashflow
$-308/mo
Annual
$-3,699/yr
Cap rate
5.69%
Cash-on-cash
-2.17%
DSCR
0.90
1% rule
0.68%
Cash to close
$170,800
Investor read
- This is a 3×2bd/1ba + 1×1bd/1ba units multifamily listed at $610k.
- At list price, monthly cash flow is $-308 ($-4k/yr) — negative. Per door: $-77/mo.
- To cash-flow at today's rent, offer at most $556k (8.9% below list).
- To meet the 1% rule (rent ≥ 1% of price), the offer needs to be $416k (31.9% below list).
- It's been on market 27 days — a 2% lower offer ($601k) is reasonable based on typical stale-listing flexibility.
- Recommended offer: $416k (31.9% below list) — sets the bar for 1% rule.
- Local home prices are declining (-3.0%/yr); year-one equity from $4k of loan paydown is wiped out by about $18k of value loss. Plan a longer hold.
- Location reads 80/100 on livability (#2 in NV, #1,723 nationally) — a professional / high-income tenant draw. Strengths: amenities A+, commute A+, housing A+; Watch: crime F.
- Clark County School District (urban): math 21% / reading 39% proficiency, ranked #11 of 17 in NV (top 65%) — families likely to look elsewhere, expect single-tenant / working-renter base with shorter leases.
- Market conditions: Rents rising (+2.5%/yr); 188 active listings in the ZIP; lower-income renter base — watch delinquency; 14,754 units permitted in Clark County in 2024 (2,301 in 5+ unit buildings).
- Clark County population projected at +36% by 2050 — long-run rental-demand tailwind backs the buy-and-hold thesis.
- 8 sale attempts since 11y ago with the ask held roughly flat each time — persistent listings suggest the price (not the market) is what's stuck; bring a comps-based counter.
- Climate carrying-cost: extreme-heat days projected 7→18/yr by 2055 (HVAC capex compounding) — expect insurance premiums to compound above CPI over the hold.
- At $4,156/mo this rent would consume 126% of the median local household income ($39k/yr) (locally 3814% of renters already pay >50% of income on rent) — very limited rent-growth headroom before tenants either downsize or default.
Questions for listing agent
- What do current leases actually rent for vs. the listed asking? Can we see a recent rent roll and the last 12 months of T-12 income?
- Can we see the unit-by-unit rent roll, current vacancy, and any below-market leases? What's the average tenancy length?
- What capital expenditures (roof, boiler, parking lot, exteriors) have been made in the last 5 years, and what's planned in the next 2?
- Built in 1963 — when were the roof, HVAC, electrical panel, plumbing, and water heater last replaced?
- Is there a deadline driving the sale (1031 exchange, divorce, estate, relocation)? That informs how much negotiation room exists.
- Crime grade is F in this area — have there been break-ins, vandalism, or insurance claims at this property in the last 3 years? What carrier currently insures it and at what premium?
- The area grade is low — what's the realistic commute time and amenity access for the typical tenant pool here? Any planned neighborhood developments (good or bad) we should know about?
- What's the average days-on-market for RENTAL listings here right now (not sales)? A rising rental-DOM trend means longer vacancies and softer asking-rent achievability than the comps imply.
CashFlowRE · CFR-FFKNRT7RGF3KE2
· Data 2 days ago
cashflowre.app · 2026-05-29