 Fourplex
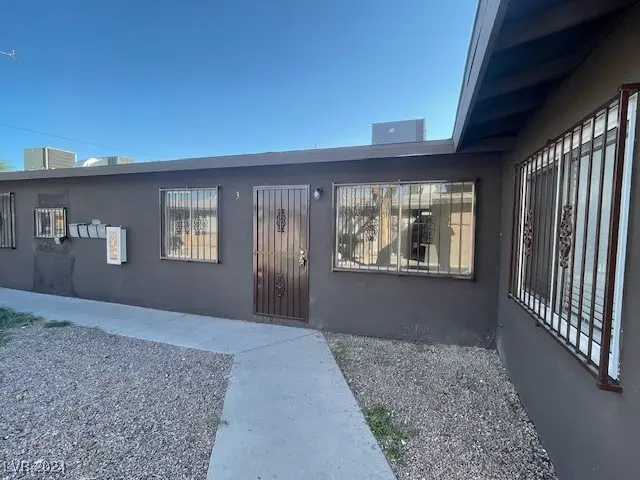
2504 E Mesquite Ave · Las Vegas, NV
Flood risk 1/10 · Minimal
- FEMA flood zone
- X (unshaded)
- Chance of flooding over 30 yrs
- 0.0%
- Est. flood insurance / yr
- $507 – $1,088
Fire risk 1/10 · Minimal
- Est. fire insurance / yr
- $490 – $910
Heat risk 8/10 · Major
- Hot days now (above 107°F)
- 7 days/yr
- Hot days in 30 yrs
- 18 days/yr
Wind risk 1/10 · Minimal
- Chance of severe wind over 30 yrs
- —
Air-quality risk 4/10 · Minor
- Unhealthy air days now
- 4 days/yr
- Unhealthy air days in 30 yrs
- 5 days/yr
Risk factors via First Street. Map © Google.
Why this score? — see what drove the D- grade
The composite is a weighted blend of 9 inputs, each scored 0–100. Each bar is that input's sub-score; the figure is the points it added to the 100-point composite (weight × sub-score).
- Cash flow +10.5/30.0
- ARV discount +7.5/15.0
- Livability +4.0/5.0
- Rent growth +3.1/5.0
- DSCR +3.0/10.0
- Schools +2.6/10.0
- Condition / age +2.5/5.0
- 1% rule +1.8/10.0
- Appreciation +0.0/10.0
$610,000
🖨 Deal sheet 📄 Offer letter ✓ Due diligence
Multi-family units
County records classify this as Multi-Family (2-4 Unit). Listing-text estimate: 4 units. confirmed
Listing remarks MLS
Location! Location! Investor's Dream FourPlex with 3-2 Bedroom Units and 1-1 Bedroom Unit. Enter into each Apartment's Spacious Front Entry Living Room, Full Size Kitchen, Separate Dining Area, Full Bathroom and Spacious Bedrooms. Located near Schools, Shopping Retail Centers, Highway Access and Much More. Convenient Parking. FHA / VA / Cash / Conv and Investment Buyer Offers will also be entertained. A Must See.
Key facts
- Fourplex
- Long-term upside
- Centrally located
Tags
Property features AI
Finance
- Other: Rental information: unit rents reported around $1,400, $1,300 and $1,377 for individual units; one unit rent listed as $1,400 and another as $1,377
- Financial info: Annual tax reported
Exterior
- Utilities: Public water; Public sewer
- Home design: Single-story building; Fourplex (one building with four units); Pitched roof
- Construction: Stucco and wood frame construction
- Exterior features: Located on a 0.14-acre lot; Average condition, resale property
Interior
- Kitchen: Oven; Range; Refrigerator
- Bedrooms: Four units: three 2-bedroom units and one 1-bedroom unit
- Flooring: Tile
- Bathrooms: Each unit has one full bathroom
- Heating & cooling: Central heating (electric); Central air conditioning
- Interior features: Blinds and window treatments; Tile flooring; Unfurnished
Neighborhood map
What this means for you Summary
Snapshot
- This is a 3×2bd/1ba + 1×1bd/1ba units multifamily listed at $610k.
Deal economics
- At list price, monthly cash flow is $-308 ($-4k/yr) — negative. Per door: $-77/mo.
- To cash-flow at today's rent, offer at most $556k (8.9% below list).
- To meet the 1% rule (rent ≥ 1% of price), the offer needs to be $416k (31.9% below list).
- Recommended offer: $416k (31.9% below list) — sets the bar for 1% rule.
Location & tenants
- Location reads 80/100 on livability (#2 in NV, #1,723 nationally) — a professional / high-income tenant draw. Strengths: amenities A+, commute A+, housing A+; Watch: crime F.
- Clark County School District (urban): math 21% / reading 39% proficiency, ranked #11 of 17 in NV (top 65%) — families likely to look elsewhere, expect single-tenant / working-renter base with shorter leases.
- Market conditions: Rents rising (+2.5%/yr); 188 active listings in the ZIP; lower-income renter base — watch delinquency; 14,754 units permitted in Clark County in 2024 (2,301 in 5+ unit buildings).
- At $4,156/mo this rent would consume 126% of the median local household income ($39k/yr) (locally 3814% of renters already pay >50% of income on rent) — very limited rent-growth headroom before tenants either downsize or default.
Forward outlook
- Local home prices are declining (-3.0%/yr); year-one equity from $4k of loan paydown is wiped out by about $18k of value loss. Plan a longer hold.
- Clark County population projected at +36% by 2050 — long-run rental-demand tailwind backs the buy-and-hold thesis.
Negotiation context
- It's been on market 27 days — a 2% lower offer ($601k) is reasonable based on typical stale-listing flexibility.
- 8 sale attempts since 11y ago with the ask held roughly flat each time — persistent listings suggest the price (not the market) is what's stuck; bring a comps-based counter.
Risks & watch-outs
- Climate carrying-cost: extreme-heat days projected 7→18/yr by 2055 (HVAC capex compounding) — expect insurance premiums to compound above CPI over the hold.
Questions for the listing agent
- What do current leases actually rent for vs. the listed asking? Can we see a recent rent roll and the last 12 months of T-12 income?
- Can we see the unit-by-unit rent roll, current vacancy, and any below-market leases? What's the average tenancy length?
- What capital expenditures (roof, boiler, parking lot, exteriors) have been made in the last 5 years, and what's planned in the next 2?
- Built in 1963 — when were the roof, HVAC, electrical panel, plumbing, and water heater last replaced?
- Is there a deadline driving the sale (1031 exchange, divorce, estate, relocation)? That informs how much negotiation room exists.
- Crime grade is F in this area — have there been break-ins, vandalism, or insurance claims at this property in the last 3 years? What carrier currently insures it and at what premium?
- The area grade is low — what's the realistic commute time and amenity access for the typical tenant pool here? Any planned neighborhood developments (good or bad) we should know about?
- What's the average days-on-market for RENTAL listings here right now (not sales)? A rising rental-DOM trend means longer vacancies and softer asking-rent achievability than the comps imply.
- What's the recent tenant-quality profile in this submarket — average credit score on applications, eviction rate, late-payment / NSF rate, and stable-employment percentage? A property-management company in the area should have these aggregated.
- How much new apartment / multifamily construction is in the pipeline within 1–3 miles? Heavy new supply (>2% of stock underway) typically softens rents 12–24 months out; light construction supports rent growth.
Investment metrics
- 1% rule
- 0.68% ✗
- Cap rate
- 5.69%
- Cash-on-cash
- -2.17%
- DSCR
- 0.90
- GRM
- 12.2
CMA / ARV
No comps found within radius.
Projected returns pro-forma
-3.0% appreciation · 2.51% rent growth · sell at horizon
- IRR
- -20.4%
- Equity multiple
- 0.29×
- Total profit
- $-120,836
- Equity at exit
- $90,953
- IRR
- -14.6%
- Equity multiple
- 0.18×
- Total profit
- $-140,088
- Equity at exit
- $52,742
Cash invested: $170,800 (down + closing). Projections, not guarantees.
Landlord ↔ Tenant lean methodology
- Overall (STATE)
- 71 Landlord-Friendly
- State Nevada
- 71 Landlord-Friendly · R+1
- County
- — inherits STATE
- City
- — inherits STATE
ZIP-level market 89101
- Home prices YoY
- -22.8%
- Rents YoY
- 2.5%
- Active inventory
- 188
- Price-to-rent
- 47.8×
Monthly cashflow live
- Estimated rent
- $4,156 high interval (Pro) →
- Mortgage (P&I)
- −$3,199
- Tax from tax record
- −$138 /mo · $1,661/yr
- Insurance
- −$254
- HOA
- −$0
- Vacancy / Maint / Mgmt
- −$873
- Net cashflow
- $-308
Break-even live
4-unit breakdown (identical units grouped — click to expand)
| Units | Beds | Baths | Est. rent |
|---|---|---|---|
| 3× units | 2 | 1 | $3,192 |
| #1 | 2 | 1 | $1,064 |
| #2 | 2 | 1 | $1,064 |
| #3 | 2 | 1 | $1,064 |
| 1× unit | 1 | 1 | $964 |
| Total (4 units) | $4,156 | ||
UW: 25.0% down · 7.5% · 30yr · 1.5% tax · 5.0% vac · 8.0% maint · 8.0% mgmt
Financing live
Cash to close
- Down payment
- $152,500
- Closing costs
- $18,300
- Reserves months
- —
- Total cash needed
- —
Loan-product check · same deal, 3 products live
Conventional
25% down · 7.5% · 30yr
- Down + closing
- —
- Monthly P&I
- —
- Monthly cashflow
- —
- DSCR
- —
- Eligible?
- —
Personal DTI + credit; lowest rate.
DSCR
20% down · 8.5% · 30yr
- Down + closing
- —
- Monthly P&I
- —
- Monthly cashflow
- —
- DSCR
- —
- Eligible?
- —
No personal income docs; deal must DSCR.
Hard money
10% down · 12.0% · 12mo
- Down + closing
- —
- Monthly P&I
- —
- Monthly cashflow
- —
- DSCR
- —
- Eligible?
- —
Short-term bridge; refi at stabilization.
Listing history 44 events
-
2026-06-18days on market $610,000 Active 27 DOM
-
2026-06-17days on market $610,000 Active 26 DOM
-
2026-06-16days on market $610,000 Active 25 DOM
-
2026-06-15days on market $610,000 Active 24 DOM
-
2026-06-13days on market $610,000 Active 22 DOM
-
2026-06-09days on market $610,000 Active 18 DOM
-
2026-06-08days on market $610,000 Active 17 DOM
-
2026-06-07days on market $610,000 Active 16 DOM
-
2026-06-03days on market $610,000 Active 12 DOM
-
2026-06-02days on market $610,000 Active 11 DOM
-
2026-06-01days on market $610,000 Active 10 DOM
-
2026-05-31days on market $610,000 Active 9 DOM
-
2026-05-18$610,000 Active
-
2025-01-28soldstatus $600,000 Closed 416-char remark
Show marketing remark (416 chars)
Location! Location! Investor's Dream FourPlex with 3-2 Bedroom Units and 1-1 Bedroom Unit. Enter into each Apartment's Spacious Front Entry Living Room, Full Size Kitchen, Separate Dining Area, Full Bathroom and Spacious Bedrooms. Located near Schools, Shopping Retail Centers, Highway Access and Much More. Convenient Parking. FHA / VA / Cash / Conv and Investment Buyer Offers will also be entertained. A Must See.
-
2025-01-28soldstatus $600,000
Show marketing remark (416 chars)
Location! Location! Investor's Dream FourPlex with 3-2 Bedroom Units and 1-1 Bedroom Unit. Enter into each Apartment's Spacious Front Entry Living Room, Full Size Kitchen, Separate Dining Area, Full Bathroom and Spacious Bedrooms. Located near Schools, Shopping Retail Centers, Highway Access and Much More. Convenient Parking. FHA / VA / Cash / Conv and Investment Buyer Offers will also be entertained. A Must See.
-
2025-01-06historical Active Under Contract 416-char remark
Show marketing remark (416 chars)
Location! Location! Investor's Dream FourPlex with 3-2 Bedroom Units and 1-1 Bedroom Unit. Enter into each Apartment's Spacious Front Entry Living Room, Full Size Kitchen, Separate Dining Area, Full Bathroom and Spacious Bedrooms. Located near Schools, Shopping Retail Centers, Highway Access and Much More. Convenient Parking. FHA / VA / Cash / Conv and Investment Buyer Offers will also be entertained. A Must See.
-
2024-10-20$648,000 Active 416-char remark
Show marketing remark (416 chars)
Location! Location! Investor's Dream FourPlex with 3-2 Bedroom Units and 1-1 Bedroom Unit. Enter into each Apartment's Spacious Front Entry Living Room, Full Size Kitchen, Separate Dining Area, Full Bathroom and Spacious Bedrooms. Located near Schools, Shopping Retail Centers, Highway Access and Much More. Convenient Parking. FHA / VA / Cash / Conv and Investment Buyer Offers will also be entertained. A Must See.
-
2022-11-09soldstatus $475,000
-
2022-10-03$475,000 Active
-
2020-10-03status Pending
-
2020-10-03historical
-
2020-08-17price $325,000
-
2020-08-14price $330,000
-
2020-08-08price $333,333
-
2020-08-03price $334,990
-
2020-07-30price $334,999
-
2020-07-10price $335,000
-
2020-06-25$334,999 Active
-
2020-05-22historical
-
2020-05-11$335,000 Active
-
2018-07-20soldstatus $275,000
-
2018-02-20soldstatus $275,000 Sold
-
2018-02-20soldstatus $275,000
-
2018-01-10historical Contingent Offer
-
2018-01-10$275,000 Active
-
2017-06-30historical
-
2017-05-26soldstatus $215,000
-
2016-09-01historical Contingent Offer
-
2016-07-15historical
-
2016-07-15$235,000
-
2015-08-14historical
-
2015-08-12price $235,000
-
2015-07-08price $245,000
-
2015-01-07$267,000 Exclusive Right
ⓘ Source: listings_history table (triggers on properties + properties_extension) + one-shot
backfill from property_details.listing_events for pre-trigger history.
Tax reassessment forecast NV · Resets to sale price
- Current annual tax
- $1,661 · $138/mo
- Projected year-2 tax
- $3,599 · $300/mo
- Expected delta
- +$1,938/yr (+$162/mo · 116.7%)
ⓘ Screening estimate from a state-policy table — verify with the county assessor before closing.
Climate risk First Street
- Flood 1/10 Low FEMA zone X (unshaded) · 0% chance over 30 yrs
- Wildfire 1/10 Low
- Heat 8/10 Severe 7 d/yr ≥107°F today · 18 d/yr by 30 yrs out
- Wind 1/10 Low
- Air quality 4/10 Moderate 4 unhealthy d/yr today · 5 by 30 yrs out
Nearby sold comps map
Loading sold comps map…
Walkable amenities ~0.75 mi
Loading nearby amenities…
Taxation est. · year 1
- Rental income
- $49,872
- − Mortgage interest
- −$34,169
- − Property taxes
- −$1,661
- − Insurance
- −$3,050
- − Repairs & maintenance
- −$3,990
- − Management
- −$3,990
- − Depreciation
- −$17,745
- Taxable loss
- −$14,733
- Est. tax savings @ 24.0%
- +$3,536
- After-tax cash flow
- $-163/yr
For passive investors: Depreciation is non-cash, so a rental often shows a tax loss while cash-flowing — sheltering income. Rental losses are passive: they offset passive income freely, and up to $25,000/yr can offset ordinary (W-2) income if you actively participate and your MAGI is under $100k (phasing out to $0 by $150k); unused losses carry forward. On sale, claimed depreciation is recaptured at up to 25%, and gains may owe capital-gains tax (a 1031 exchange can defer both). Figures are a year-1 estimate at your 24.0% rate — not tax advice; consult a CPA.
Schools (NCES district)
- District
- Clark County School District
- NCES district ID
- 3200060
- Math proficiency
- 21% ▼ -13.00%
- Reading proficiency
- 39% ▼ -8.00%
- Median HH income
- $53,611
- Composite
- 26.48/100
- National rank
- #7211
- State rank
- #11 of 17 in NV
Livability — Las Vegas
- Score
- 80/100
- State rank
- #2
- US rank
- #1723
Category grades
Schools grade is shown separately in the Schools card above.
Census & demographics
- Census place
- Las Vegas, NV
- County
- Clark County · 2,306,105 people
- City population
- 1,643,591
- Metro
- Las Vegas-Henderson-Paradise, NV
- Population (ZIP)
- 42,739
- Household income
- $39,459
- Rent vs Own
- Severe rent burden
- 3814.0
Population outlook (Clark County) Hauer SSP2
- Today (2025)
- 2,504,101 people
- By 2030
- 2,693,770 · +7.6%
- By 2040
- 3,061,208 · +22.2%
- By 2050
- 3,400,072 · +35.8%
- By 2075
- 4,139,522 · +65.3%
- By 2100
- 4,596,916 · +83.6%
Race, ethnicity, and origin ACS 2023
- Neighborhood character
- Diverse neighborhood (Simpson 0.61)
- Race & ethnicity
- Hispanic / Latino 57% Two or more races 19% White 19% Black 14% Asian 5% Native American 3%
- Hispanic origin (detail)
- Mexican 45% Puerto Rican 1% Cuban 1%
- Common ancestry
- Lithuanian 1% Slovak 1% Italian 1%
- Foreign-born
- 31% · Canada, China
- Languages at home
- 47% English-only · Spanish 48% Tagalog/Filipino 2% Chinese 1%
Political lean MEDSL · Clark
- 2024 margin
- Toss-up / Even · D 50.4% · R 47.8% · Other 1.7%
- 2008→2024 swing
- -16.5pp toward R · 2008: 19.1pp · 2024: 2.6pp
- All cycles
- 2024: D+2.6 2020: D+9.3 2016: D+10.7 2012: D+14.5 2008: D+19.1
Not yet ingested
- Civics
- —
Market trends
- HPI YoY
- ▼ -90.49%
- Current HPI
- 305.6227
- Rent YoY
- ▲ 2.51%
- Metro
- Las Vegas-Henderson-Paradise, NV
- State GDP YoY
- ▲ 3.08%
- F500 in state
- 6
Industry mix (Fortune 500 HQ in NV)
| Industry | F500 HQs | Revenue |
|---|---|---|
| Hotels / Casinos | 3 | $36B |
|
||
Price history
+128.5% since first listed32 events — show timeline
- 2026-05-18 Listed $610,000 GLVAR
- 2025-01-28 Sold (Public Records) $600,000 Public Records
- 2025-01-28 Sold (MLS) $600,000 GLVAR
- 2025-01-06 Contingent — GLVAR
- 2024-10-20 Listed $648,000 GLVAR
- 2022-11-09 Sold (Public Records) $475,000 Public Records
- 2022-10-03 Listed $475,000 GLVAR
- 2020-10-03 Pending — GLVAR
- 2020-10-03 Listing Removed — GLVAR
- 2020-08-17 Price Changed $325,000 GLVAR
- 2020-08-14 Price Changed $330,000 GLVAR
- 2020-08-08 Price Changed $333,333 GLVAR
- 2020-08-03 Price Changed $334,990 GLVAR
- 2020-07-30 Price Changed $334,999 GLVAR
- 2020-07-10 Price Changed $335,000 GLVAR
- 2020-06-25 Listed $334,999 GLVAR
- 2020-05-22 Listing Removed — GLVAR
- 2020-05-11 Listed $335,000 GLVAR
- 2018-07-20 Sold (Public Records) $275,000 Public Records
- 2018-02-20 Sold (Public Records) $275,000 Public Records
- 2018-02-20 Sold (MLS) $275,000 GLVAR
- 2018-01-10 Contingent — GLVAR
- 2018-01-10 Listed $275,000 GLVAR
- 2017-06-30 Listing Removed — GLVAR
- 2017-05-26 Sold (Public Records) $215,000 Public Records
- 2016-09-01 Contingent — GLVAR
- 2016-07-15 Listing Removed — GLVAR
- 2016-07-15 Listed $235,000 GLVAR
- 2015-08-14 Listing Removed — GLVAR
- 2015-08-12 Price Changed $235,000 GLVAR
- 2015-07-08 Price Changed $245,000 GLVAR
- 2015-01-07 Listed $267,000 GLVAR
Property tax history
+6.5%/yrLatest (2025): $1,661 · -56.9% YoY. Source: county tax records.
Cash-flow waterfall
monthlySold comps — $/sqft
last 12 mo · ≤1 miLoading sold comps…