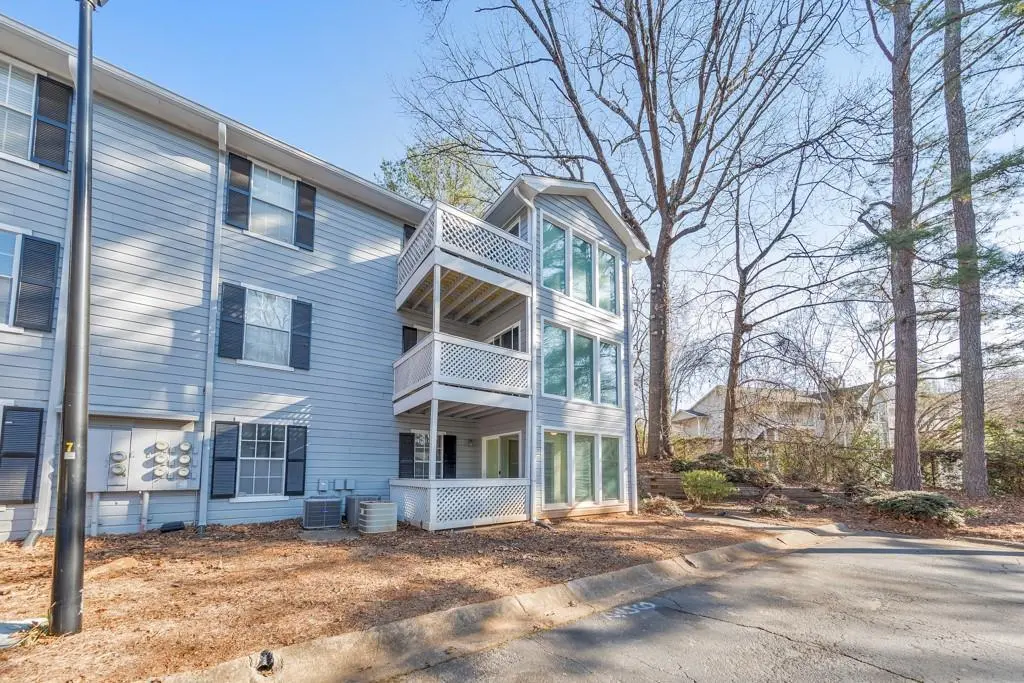
201 Natchez Trce
Sandy Springs, GA 30350
$178,000D-
2 bd · 1.0 ba ·
1,126 sqft ·
Built 1982
· Condo
· Active
· 121 DOM
Cashflow @ list (25.0% down · 7.5%)
Estimated rent
$1,654/mo
Mortgage (P&I)
−$933
Tax + insurance
−$156
HOA
−$470
Vac / Maint / Mgmt
−$347
Net cashflow
$-252/mo
Annual
$-3,028/yr
Cap rate
4.59%
Cash-on-cash
-6.08%
DSCR
0.73
1% rule
0.93%
Cash to close
$49,840
Investor read
- This is a 2-bed/1.0-bath condo listed at $178k.
- At list price, monthly cash flow is $-252 ($-3k/yr) — negative.
- To cash-flow at today's rent, offer at most $133k (25.0% below list).
- To meet the 1% rule (rent ≥ 1% of price), the offer needs to be $165k (7.1% below list).
- It's been on market 121 days — a 12% lower offer ($157k) is reasonable based on typical stale-listing flexibility.
- Recommended offer: $133k (25.0% below list) — sets the bar for cash-flow.
- Local home prices are declining (-3.0%/yr); year-one equity from $1k of loan paydown is wiped out by about $5k of value loss. Plan a longer hold.
- Location reads 73/100 on livability (#45 in GA) — a middle-class / working-renter tenant base. Strengths: employment A+, crime A-, commute A-; Watch: amenities F, cost of living F.
- Fulton County (suburban): math 49% / reading 53% proficiency, ranked #12 of 174 in GA (top 7%) — acceptable for families but not a draw, mixed tenant base, ~2y average lease.
- Watch-outs: HOA is 28% of rent.
- Market conditions: Rents soft (-0.3%/yr); 170 active listings in the ZIP; 38 comparable units currently listed for rent nearby; rentals leasing fast (median 6d on market — plan ~1-2 weeks tenant-placement turnaround); solid renter incomes; 11,565 units permitted in Fulton County in 2024 (8,159 in 5+ unit buildings).
- Fulton County population projected at +38% by 2050 — long-run rental-demand tailwind backs the buy-and-hold thesis.
- 2 sale attempts; this cycle's ask has dropped $22k (11%) from the opening price — seller is motivated, your offer sets the floor, not the list.
- Current owner paid $90k; list at $178k implies a 98% gain — meaningful room to come down on a strong offer.
- Climate carrying-cost: extreme-heat days projected 7→18/yr by 2055 (HVAC capex compounding) — expect insurance premiums to compound above CPI over the hold.
- Cap rate 4.6% vs local median 2.7% in Sandy Springs — top-decile yield for the area; either an underpriced asset or a hidden risk that comps aren't pricing in. Stress-test before assuming the spread holds.
Questions for listing agent
- What do current leases actually rent for vs. the listed asking? Can we see a recent rent roll and the last 12 months of T-12 income?
- It's been on market 121 days. Have you received any prior offers? Is the seller open to a 25% concession, seller financing, or rate buy-down credit?
- What does the HOA fee cover, when was the last increase, and are there any pending special assessments or reserve-fund shortfalls?
- Any open or pending special assessments — roof, HVAC, plumbing, elevator, façade? What's the per-unit balance and payoff schedule, and is the seller paying it off at close or rolling it to the buyer?
- Why hasn't it sold? Are there any deal-killer items the seller is aware of (foundation, flood, title, zoning, code violations)?
- Is there a deadline driving the sale (1031 exchange, divorce, estate, relocation)? That informs how much negotiation room exists.
- The area grade is low — what's the realistic commute time and amenity access for the typical tenant pool here? Any planned neighborhood developments (good or bad) we should know about?
- What's the average days-on-market for RENTAL listings here right now (not sales)? A rising rental-DOM trend means longer vacancies and softer asking-rent achievability than the comps imply.
CashFlowRE · CFR-FH68Z810FJMBBB
· Data 2 days ago
cashflowre.app · 2026-05-29