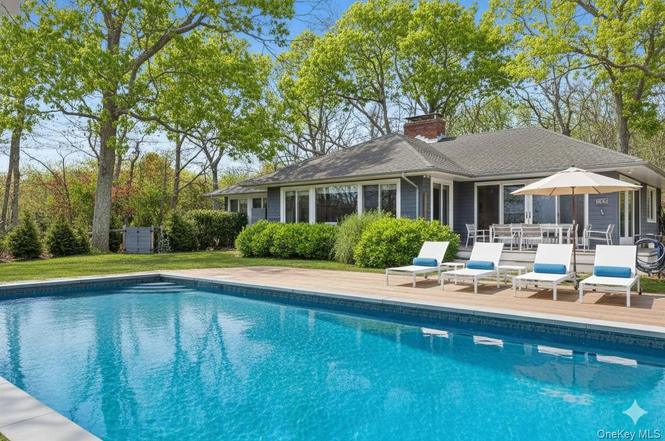
68 Three Mi Hbr Hog Crk Hwy
Springs, NY 11937
$2,700,000D-
4 bd · 4.0 ba ·
3,040 sqft ·
Built 1947
· SingleFamily
· Pending
· 100 DOM
Cashflow @ list (25.0% down · 7.5%)
Estimated rent
$23,128/mo
Mortgage (P&I)
−$14,159
Tax + insurance
−$4,500
HOA
−$0
Vac / Maint / Mgmt
−$4,857
Net cashflow
$-388/mo
Annual
$-4,660/yr
Cap rate
6.12%
Cash-on-cash
-0.62%
DSCR
0.97
1% rule
0.86%
Cash to close
$756,000
Investor read
- This is a 4-bed/4.0-bath single-family listed at $2.70M.
- At list price, monthly cash flow is $-388 ($-5k/yr) — negative.
- To cash-flow at today's rent, offer at most $2.64M (2.1% below list).
- To meet the 1% rule (rent ≥ 1% of price), the offer needs to be $2.31M (14.3% below list).
- It's been on market 100 days — a 9% lower offer ($2.46M) is reasonable based on typical stale-listing flexibility.
- Recommended offer: $2.31M (14.3% below list) — sets the bar for 1% rule.
- Local home prices are declining (-3.0%/yr); year-one equity from $19k of loan paydown is wiped out by about $81k of value loss. Plan a longer hold.
- Location reads 63/100 on livability (#809 in NY) — a middle-class / working-renter tenant base. Strengths: crime A+, employment A+; Watch: housing C-, amenities F, commute F.
- Springs Union Free School District (town): math 55% / reading 60% proficiency, ranked #239 of 590 in NY (top 40%) — acceptable for families but not a draw, mixed tenant base, ~2y average lease; only 9% free/reduced lunch — higher-income household profile.
- Zoned schools: Springs School (math 55% / reading 60%, grade C+, #839 of 2,108 statewide, top 40%, 689 students, 0% FRL).
- Watch-outs: built in 1947 — expect roof / HVAC / electrical / plumbing capex.
- Market conditions: Rents rising fast (+12.3%/yr); 135 active listings in the ZIP; 5 comparable units currently listed for rent nearby; rentals lingering (median 46d on market — plan ~5-8 weeks vacancy on turnover, expect pricing pressure); 60% of comp listings sitting > 30 days — soft ceiling on asking rent; high-income renter base; 1,366 units permitted in Suffolk County in 2024 (216 in 5+ unit buildings).
- Suffolk County population projected to shrink 5% by 2050 — rents likely to lag national; underwrite the cash flow, not the appreciation.
- Cap rate 6.1% vs local median 11.1% in Springs — below-typical yield; the buyer is paying a premium for something (appreciation thesis, condition, location) that the cap rate doesn't capture.
- At $23,128/mo this rent would consume 214% of the median local household income ($130k/yr) (locally 896% of renters already pay >50% of income on rent) — very limited rent-growth headroom before tenants either downsize or default.
Questions for listing agent
- What do current leases actually rent for vs. the listed asking? Can we see a recent rent roll and the last 12 months of T-12 income?
- It's been on market 100 days. Have you received any prior offers? Is the seller open to a 14% concession, seller financing, or rate buy-down credit?
- Built in 1947 — when were the roof, HVAC, electrical panel, plumbing, and water heater last replaced?
- Why hasn't it sold? Are there any deal-killer items the seller is aware of (foundation, flood, title, zoning, code violations)?
- Is there a deadline driving the sale (1031 exchange, divorce, estate, relocation)? That informs how much negotiation room exists.
- Schools are D-rated, which usually means shorter tenancies and higher turnover. Who's the typical renter profile here, and what's been the actual vacancy rate?
- The area grade is low — what's the realistic commute time and amenity access for the typical tenant pool here? Any planned neighborhood developments (good or bad) we should know about?
- What's the average days-on-market for RENTAL listings here right now (not sales)? A rising rental-DOM trend means longer vacancies and softer asking-rent achievability than the comps imply.
CashFlowRE · CFR-FHHBER49G3VVQE
· Data 4 weeks ago
cashflowre.app · 2026-05-29