68 Three Mi Hbr Hog Crk Hwy · Springs, NY
Flood risk No data
- FEMA flood zone
- —
- Chance of flooding over 30 yrs
- —
- Est. flood insurance / yr
- —
Fire risk No data
- Est. fire insurance / yr
- —
Heat risk No data
- Hot days now (above threshold)
- —
- Hot days in 30 yrs
- —
Wind risk No data
- Chance of severe wind over 30 yrs
- —
Air-quality risk No data
- Unhealthy air days now
- —
- Unhealthy air days in 30 yrs
- —
Risk factors via First Street. Map © Google.
Why this score? — see what drove the D- grade
The composite is a weighted blend of 9 inputs, each scored 0–100. Each bar is that input's sub-score; the figure is the points it added to the 100-point composite (weight × sub-score).
- Cash flow +12.5/30.0
- Schools +5.1/10.0
- Rent growth +5.0/5.0
- DSCR +3.7/10.0
- 1% rule +3.6/10.0
- Livability +3.2/5.0
- Condition / age +2.5/5.0
- ARV discount +0.0/15.0
- Appreciation +0.0/10.0
$2,700,000
🖨 Deal sheet (PDF) 📄 Offer letter ✓ Due diligence
Listing remarks
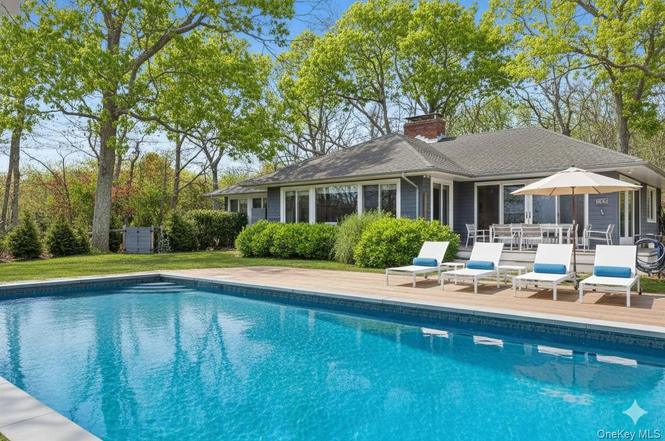
Breathtaking Sunset Views. Summer sunsets from your west-facing hilltop perch across the street from the multiple marinas edging the tranquil waters of East Hampton's world-famous Three Mile Harbor. Professional chef's kitchen with oversized stainless-steel commercial stove and refrigerator - this kitchen must be seen. Trust us; if you are a serious cook, you cannot live without this irreplaceable space. Designed for those who love to cook, gather, and entertain with ease, this home offers a setting that naturally brings people together. Evenings here are defined by glowing sunsets, open conversations, and effortless indoor-outdoor living. At grade, three bedrooms and two bathrooms on the m
Key facts
- Landscaped grounds
- Outdoor shower
- Room for expansion
Tags
Neighborhood map
What this means for you Summary
Snapshot
- This is a 4-bed/4.0-bath single-family listed at $2.70M.
Deal economics
- At list price, monthly cash flow is $-388 ($-5k/yr) — negative.
- To cash-flow at today's rent, offer at most $2.64M (2.1% below list).
- To meet the 1% rule (rent ≥ 1% of price), the offer needs to be $2.31M (14.3% below list).
- Recommended offer: $2.31M (14.3% below list) — sets the bar for 1% rule.
- Cap rate 6.1% vs local median 11.1% in Springs — below-typical yield; the buyer is paying a premium for something (appreciation thesis, condition, location) that the cap rate doesn't capture.
Location & tenants
- Location reads 63/100 on livability (#809 in NY) — a middle-class / working-renter tenant base. Strengths: crime A+, employment A+; Watch: housing C-, amenities F, commute F.
- Springs Union Free School District (town): math 55% / reading 60% proficiency, ranked #239 of 590 in NY (top 40%) — acceptable for families but not a draw, mixed tenant base, ~2y average lease; only 9% free/reduced lunch — higher-income household profile.
- Zoned schools: Springs School (math 55% / reading 60%, grade C+, #839 of 2,108 statewide, top 40%, 689 students, 0% FRL).
- Market conditions: Rents rising fast (+12.3%/yr); 135 active listings in the ZIP; 5 comparable units currently listed for rent nearby; rentals lingering (median 46d on market — plan ~5-8 weeks vacancy on turnover, expect pricing pressure); 60% of comp listings sitting > 30 days — soft ceiling on asking rent; high-income renter base; 1,366 units permitted in Suffolk County in 2024 (216 in 5+ unit buildings).
- At $23,128/mo this rent would consume 214% of the median local household income ($130k/yr) (locally 896% of renters already pay >50% of income on rent) — very limited rent-growth headroom before tenants either downsize or default.
Forward outlook
- Local home prices are declining (-3.0%/yr); year-one equity from $19k of loan paydown is wiped out by about $81k of value loss. Plan a longer hold.
- Suffolk County population projected to shrink 5% by 2050 — rents likely to lag national; underwrite the cash flow, not the appreciation.
Negotiation context
- It's been on market 100 days — a 9% lower offer ($2.46M) is reasonable based on typical stale-listing flexibility.
Risks & watch-outs
- Watch-outs: built in 1947 — expect roof / HVAC / electrical / plumbing capex.
Questions for the listing agent
- What do current leases actually rent for vs. the listed asking? Can we see a recent rent roll and the last 12 months of T-12 income?
- It's been on market 100 days. Have you received any prior offers? Is the seller open to a 14% concession, seller financing, or rate buy-down credit?
- Built in 1947 — when were the roof, HVAC, electrical panel, plumbing, and water heater last replaced?
- Why hasn't it sold? Are there any deal-killer items the seller is aware of (foundation, flood, title, zoning, code violations)?
- Is there a deadline driving the sale (1031 exchange, divorce, estate, relocation)? That informs how much negotiation room exists.
- Schools are D-rated, which usually means shorter tenancies and higher turnover. Who's the typical renter profile here, and what's been the actual vacancy rate?
- The area grade is low — what's the realistic commute time and amenity access for the typical tenant pool here? Any planned neighborhood developments (good or bad) we should know about?
- What's the average days-on-market for RENTAL listings here right now (not sales)? A rising rental-DOM trend means longer vacancies and softer asking-rent achievability than the comps imply.
- What's the recent tenant-quality profile in this submarket — average credit score on applications, eviction rate, late-payment / NSF rate, and stable-employment percentage? A property-management company in the area should have these aggregated.
- How much new for-sale + rental construction is in the pipeline within 1–3 miles? Heavy new supply typically softens prices + rents 12–24 months out; constrained supply supports both.
Investment metrics
- 1% rule
- 0.86% ✗
- Cap rate
- 6.12%
- Cash-on-cash
- -0.62%
- DSCR
- 0.97
- GRM
- 9.7
CMA / ARV
- ARV (on-the-fly)
- $2,173,600
- Comps found
- 3
Show comp detail 3 sales within ~0.75 mi
| Address | Dist | Beds/Ba | Sqft | Sold | Price | $/sf | Match |
|---|---|---|---|---|---|---|---|
| 60 Kings Point Rd | 0.53mi | 4/4.5 | 3,000 (-1%) | 15mo | $2,500,000 | $833 | 59 |
| 149 Norfolk Dr | 0.45mi | 4/6.0 | 3,110 (+2%) | 16mo | $2,225,000 | $715 | 54 |
| 16 Pembroke Dr | 0.60mi | 3/3.0 (-1) | 2,701 (-11%) | 17mo | $1,775,000 | $657 | 30 |
Match score weights: distance 35% · size 25% · config 20% · recency 20%. Top-matched comps best support the ARV.
Projected returns pro-forma
-3.0% appreciation · 8.0% rent growth · sell at horizon
- IRR
- -11.9%
- Equity multiple
- 0.55×
- Total profit
- $-339,676
- Equity at exit
- $402,579
- IRR
- 3.4%
- Equity multiple
- 1.30×
- Total profit
- $230,078
- Equity at exit
- $233,447
Cash invested: $756,000 (down + closing). Projections, not guarantees.
Landlord ↔ Tenant lean methodology
- Overall (STATE)
- 15 Strongly Tenant-Friendly
- State New York
- 15 Strongly Tenant-Friendly · D+10
- County
- — inherits STATE
- City
- — inherits STATE
ZIP-level market 11937
- Rents YoY
- 12.3%
- Active inventory
- 135
- Price-to-rent
- 9.7×
Monthly cashflow live
- Estimated rent
- $23,128 medium interval (Pro) →
- Mortgage (P&I)
- −$14,159
- Tax est. 1.5%
- −$3,375 /mo · $40,500/yr
- Insurance
- −$1,125
- HOA
- −$0
- Vacancy / Maint / Mgmt
- −$4,857
- Net cashflow
- $-388
Break-even live
Sensitivity live
| Price | -10% $1,478 | -5% $545 | +0% $-388 | +5% $-1,321 | +10% $-2,254 |
|---|---|---|---|---|---|
| Rent | -10% $-2,215 | -5% $-1,302 | +0% $-388 | +5% $525 | +10% $1,439 |
| Rate | -1.0pp $971 | -0.5pp $298 | base $-388 | +0.5pp $-1,088 | +1.0pp $-1,800 |
UW: 25.0% down · 7.5% · 30yr · 1.5% tax · 5.0% vac · 8.0% maint · 8.0% mgmt
Financing live
Cash to close
- Down payment
- $675,000
- Closing costs
- $81,000
- Reserves months
- —
- Total cash needed
- —
Loan-product check · same deal, 3 products live
Conventional
25% down · 7.5% · 30yr
- Down + closing
- —
- Monthly P&I
- —
- Monthly cashflow
- —
- DSCR
- —
- Eligible?
- —
Personal DTI + credit; lowest rate.
DSCR
20% down · 8.5% · 30yr
- Down + closing
- —
- Monthly P&I
- —
- Monthly cashflow
- —
- DSCR
- —
- Eligible?
- —
No personal income docs; deal must DSCR.
Hard money
10% down · 12.0% · 12mo
- Down + closing
- —
- Monthly P&I
- —
- Monthly cashflow
- —
- DSCR
- —
- Eligible?
- —
Short-term bridge; refi at stabilization.
Rent comps 5 comps
| Address | Beds | Baths | Sqft | Rent | $/sqft | DOM | Units | Dist |
|---|---|---|---|---|---|---|---|---|
| 104 Waterhole Rd East Hampton, NY | 4.0 | 2.5 | 2500 | $65,000 | $26.00 | 26d | 1 | 0.43mi |
| 83 Rutland Rd East Hampton, NY | 4.0 | 3.5 | 2500 | $20,000 | $8.00 | 45d | 1 | 0.59mi |
| 89 Isle of Wight Rd East Hampton, NY | 3.0 | 2.5 | 2600 | $6,000 | $2.31 | 20d | 1 | 0.61mi |
| 63 Isle of Wight Rd East Hampton, NY | 4.0 | 3.5 | 2400 | $13,000 | $5.42 | 45d | 1 | 0.64mi |
| 1039 Springs Fireplace Rd East Hampton, NY | 3.0 | 3.0 | 2500 | $85,000 | $34.00 | 45d | 1 | 1.03mi |
Listing history 2 events
-
2026-04-01status Pending
-
2025-12-22$2,700,000 Active
ⓘ Source: listings_history table (triggers on properties + properties_extension) + one-shot
backfill from property_details.listing_events for pre-trigger history.
Nearby sold comps map
Loading sold comps map…
Walkable amenities ~0.75 mi
Loading nearby amenities…
Taxation est. · year 1
- Rental income
- $277,531
- − Mortgage interest
- −$151,242
- − Property taxes
- −$40,500
- − Insurance
- −$13,500
- − Repairs & maintenance
- −$22,202
- − Management
- −$22,202
- − Depreciation
- −$78,545
- Taxable loss
- −$50,662
- Est. tax savings @ 24.0%
- +$12,159
- After-tax cash flow
- $7,499/yr
For passive investors: Depreciation is non-cash, so a rental often shows a tax loss while cash-flowing — sheltering income. Rental losses are passive: they offset passive income freely, and up to $25,000/yr can offset ordinary (W-2) income if you actively participate and your MAGI is under $100k (phasing out to $0 by $150k); unused losses carry forward. On sale, claimed depreciation is recaptured at up to 25%, and gains may owe capital-gains tax (a 1031 exchange can defer both). Figures are a year-1 estimate at your 24.0% rate — not tax advice; consult a CPA.
Schools (NCES district)
- District
- Springs Union Free School District
- NCES district ID
- 3627900
- Math proficiency
- 55% ▲ 6.00%
- Reading proficiency
- 60% ▲ 10.00%
- Median HH income
- $75,413
- Composite
- 51.42/100
- National rank
- #1728
- State rank
- #239 of 590 in NY
Livability — Springs
- Score
- 63/100
- State rank
- #809
- US rank
- #15666
Category grades
Schools grade is shown separately in the Schools card above.
Census & demographics
- Census place
- Springs, NY
- County
- Suffolk County · 679,920 people
- Metro
- New York-Newark-Jersey City, NY-NJ-PA
- Population (ZIP)
- 21,882
- Household income
- $129,883
- Rent vs Own
- Severe rent burden
- 896.0
Population outlook (Suffolk County) Hauer SSP2
- Today (2025)
- 1,505,262 people
- By 2030
- 1,498,318 · -0.5%
- By 2040
- 1,471,101 · -2.3%
- By 2050
- 1,424,848 · -5.3%
- By 2075
- 1,337,157 · -11.2%
- By 2100
- 1,217,720 · -19.1%
Race, ethnicity, and origin ACS 2023
- Neighborhood character
- Majority White (61%)
- Race & ethnicity
- White 61% Hispanic / Latino 32% Two or more races 23% Black 2% Asian 2%
- Hispanic origin (detail)
- Mexican 2% Puerto Rican 1%
- Common ancestry
- Romanian 5% Scotch-Irish 4% Italian 2%
- Foreign-born
- 25% · Canada, Guatemala, Jamaica
- Languages at home
- 68% English-only · Spanish 28% Other Indo-European 1% Russian/Polish/Slavic 1%
Political lean MEDSL · Suffolk
- 2024 margin
- Lean R (+10.0) · D 45.0% · R 55.0%
- 2008→2024 swing
- -16.0pp toward R · 2008: 6.0pp · 2024: -10.0pp
- All cycles
- 2024: R+10.0 2020: R+0.0 2016: R+8.2 2012: D+2.9 2008: D+6.0
Not yet ingested
- Civics
- —
Market trends
- HPI YoY
- ▼ -285.21%
- Current HPI
- 444.1499
- Rent YoY
- ▲ 12.28%
- Metro
- New York-Newark-Jersey City, NY-NJ-PA
- State GDP YoY
- ▲ 2.60%
- F500 in state
- 92
Industry mix (Fortune 500 HQ in NY)
| Industry | F500 HQs | Revenue |
|---|---|---|
| Financial Services | 10 | $950B |
|
||
| Consumer Goods | 9 | $162B |
|
||
| Insurance | 4 | $225B |
|
||
| Telecommunications | 2 | $144B |
|
||
| Pharmaceuticals | 2 | $112B |
|
||
| Media / Entertainment | 2 | $69B |
|
||
Price history
2 events — show timeline
- 2026-04-01 Pending — OneKey® MLS as Distributed by MLS Grid
- 2025-12-22 Listed $2,700,000 OneKey® MLS as Distributed by MLS Grid
Cash-flow waterfall
monthlySold comps — $/sqft
last 12 mo · ≤1 miLoading sold comps…