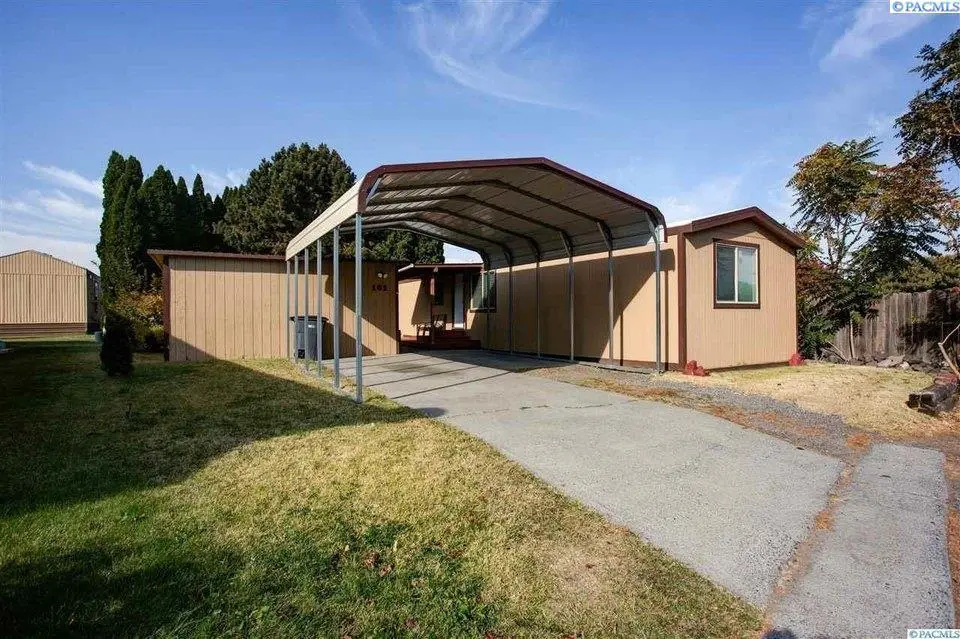
3324 W 19th Ave #161
Kennewick, WA 99338
$75,000B+
2 bd · 2.0 ba ·
924 sqft ·
Built 1985
· Manufactured
· Active
· 55 DOM
Cashflow @ list (25.0% down · 7.5%)
Estimated rent
$1,530/mo
Mortgage (P&I)
−$393
Tax + insurance
−$50
HOA
−$0
Vac / Maint / Mgmt
−$321
Net cashflow
$765/mo
Annual
$9,185/yr
Cap rate
18.54%
Cash-on-cash
43.74%
DSCR
2.95
1% rule
2.04%
Cash to close
$21,000
Investor read
- This is a 2-bed/2.0-bath manufactured listed at $75k.
- At list price, monthly cash flow is $765 ($9k/yr) — positive.
- The deal already cash-flows at list — no discount required.
- Meets the 1% rule at list price ($2k rent vs $75k).
- It's been on market 55 days — a 3% lower offer ($73k) is reasonable based on typical stale-listing flexibility.
- Recommended offer: $73k (3.0% below list) — sets the bar for market timing.
- Local home prices are declining (-3.0%/yr); year-one equity from $519 of loan paydown is wiped out by about $2k of value loss. Plan a longer hold.
- Location reads 78/100 on livability (#131 in WA, #2,599 nationally) — a middle-class / working-renter tenant base. Strengths: commute A+, housing A+, health & safety A; Watch: amenities D+, crime F.
- Kennewick School District (urban): math 43% / reading 58% proficiency, ranked #141 of 291 in WA (top 48%) — acceptable for families but not a draw, mixed tenant base, ~2y average lease.
- Zoned schools: Lincoln Elementary School (435 students, 58% FRL); Highlands Middle School (750 students, 84% FRL); Southridge High School (1,641 students, 55% FRL) — zoned schools average 66% FRL vs 48% district-wide (18 pts higher); higher-poverty schools than district average — tighter screening recommended.
- Market conditions: 311 active listings in the ZIP; 40 comparable units currently listed for rent nearby; rentals at typical pace (median 23d on market — plan ~3-4 weeks tenant-placement turnaround); high-income renter base; 1,532 units permitted in Benton County in 2024 (389 in 5+ unit buildings).
- Benton County population projected at +32% by 2050 — long-run rental-demand tailwind backs the buy-and-hold thesis.
- 2 sale attempts since 8y ago with the ask held roughly flat each time — persistent listings suggest the price (not the market) is what's stuck; bring a comps-based counter.
- At projected returns (-3.0% appreciation + 3.0% rent growth), your $21k cash investment doubles in ~3 years — after that, you're playing with house money.
- Cap rate 18.5% vs local median 3.3% in Kennewick — top-decile yield for the area; either an underpriced asset or a hidden risk that comps aren't pricing in. Stress-test before assuming the spread holds.
- This rent is only 17% of the median local income ($111k/yr) — well below the 30% rent-burden line; pricing power to push rent on renewal without tenant pushback.
Questions for listing agent
- It's been on market 55 days. Have you received any prior offers? Is the seller open to a 3% concession, seller financing, or rate buy-down credit?
- Is there a deadline driving the sale (1031 exchange, divorce, estate, relocation)? That informs how much negotiation room exists.
- Schools are D-rated, which usually means shorter tenancies and higher turnover. Who's the typical renter profile here, and what's been the actual vacancy rate?
- Crime grade is F in this area — have there been break-ins, vandalism, or insurance claims at this property in the last 3 years? What carrier currently insures it and at what premium?
- What's the average days-on-market for RENTAL listings here right now (not sales)? A rising rental-DOM trend means longer vacancies and softer asking-rent achievability than the comps imply.
- What's the recent tenant-quality profile in this submarket — average credit score on applications, eviction rate, late-payment / NSF rate, and stable-employment percentage? A property-management company in the area should have these aggregated.
- How much new for-sale + rental construction is in the pipeline within 1–3 miles? Heavy new supply typically softens prices + rents 12–24 months out; constrained supply supports both.
CashFlowRE · CFR-FHNCXSDVZE9J5B
· Data 4 weeks ago
cashflowre.app · 2026-05-29