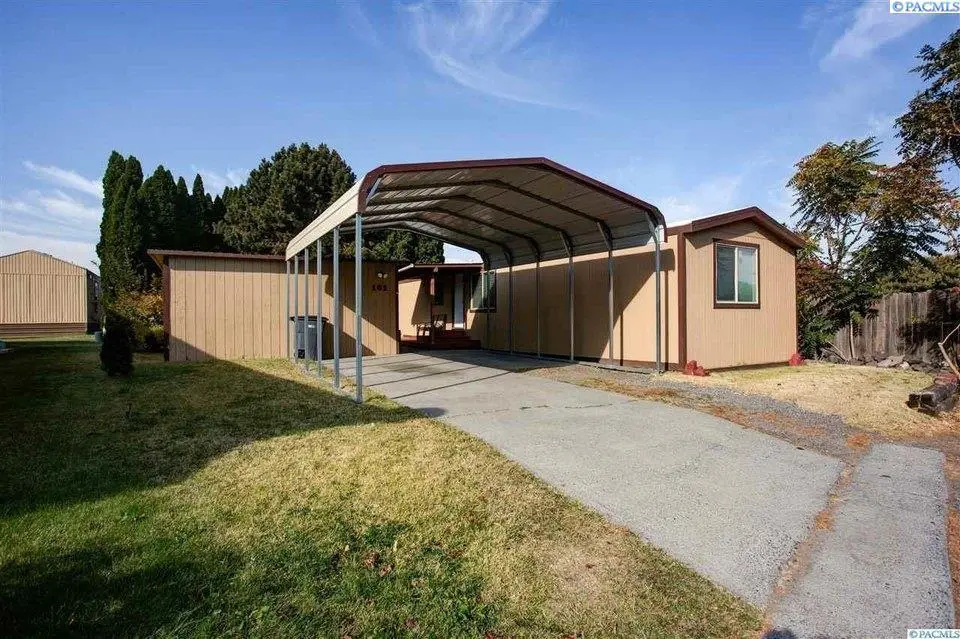
3324 W 19th Ave #161 · Kennewick, WA
Flood risk 1/10 · Minimal
- FEMA flood zone
- —
- Chance of flooding over 30 yrs
- 0.0%
- Est. flood insurance / yr
- —
Fire risk 4/10 · Minor
- Est. fire insurance / yr
- $604 – $1,122
Heat risk 4/10 · Minor
- Hot days now (above 99°F)
- 6 days/yr
- Hot days in 30 yrs
- 13 days/yr
Wind risk 1/10 · Minimal
- Chance of severe wind over 30 yrs
- —
Air-quality risk 8/10 · Major
- Unhealthy air days now
- 14 days/yr
- Unhealthy air days in 30 yrs
- 15 days/yr
Risk factors via First Street. Map © Google.
Why this score? — see what drove the B+ grade
The composite is a weighted blend of 9 inputs, each scored 0–100. Each bar is that input's sub-score; the figure is the points it added to the 100-point composite (weight × sub-score).
- Cash flow +30.0/30.0
- ARV discount +12.3/15.0
- 1% rule +10.0/10.0
- DSCR +10.0/10.0
- Schools +4.6/10.0
- Livability +3.9/5.0
- Rent growth +2.5/5.0
- Condition / age +2.5/5.0
- Appreciation +0.0/10.0
$75,000
🖨 Deal sheet (PDF) 📄 Offer letter ✓ Due diligence
Listing remarks MLS
MLS# 291657 Smart home, Alexa will turn on/off all your lights. you can program outside lights, turn off your water sink faucet with a touch. . equipped with security camaras which seller will leave if buyer wants. .seller willl finance with 10k down for 10 or 15 years
Key facts
- Security cameras
- Smart home
- Built 1985
Tags
Neighborhood map
What this means for you Summary
Snapshot
- This is a 2-bed/2.0-bath manufactured listed at $75k.
Deal economics
- At list price, monthly cash flow is $765 ($9k/yr) — positive.
- The deal already cash-flows at list — no discount required.
- Meets the 1% rule at list price ($2k rent vs $75k).
- Recommended offer: $73k (3.0% below list) — sets the bar for market timing.
- Cap rate 18.5% vs local median 3.3% in Kennewick — top-decile yield for the area; either an underpriced asset or a hidden risk that comps aren't pricing in. Stress-test before assuming the spread holds.
Location & tenants
- Location reads 78/100 on livability (#131 in WA, #2,599 nationally) — a middle-class / working-renter tenant base. Strengths: commute A+, housing A+, health & safety A; Watch: amenities D+, crime F.
- Kennewick School District (urban): math 43% / reading 58% proficiency, ranked #141 of 291 in WA (top 48%) — acceptable for families but not a draw, mixed tenant base, ~2y average lease.
- Zoned schools: Lincoln Elementary School (435 students, 58% FRL); Highlands Middle School (750 students, 84% FRL); Southridge High School (1,641 students, 55% FRL) — zoned schools average 66% FRL vs 48% district-wide (18 pts higher); higher-poverty schools than district average — tighter screening recommended.
- Market conditions: 311 active listings in the ZIP; 40 comparable units currently listed for rent nearby; rentals at typical pace (median 23d on market — plan ~3-4 weeks tenant-placement turnaround); high-income renter base; 1,532 units permitted in Benton County in 2024 (389 in 5+ unit buildings).
- This rent is only 17% of the median local income ($111k/yr) — well below the 30% rent-burden line; pricing power to push rent on renewal without tenant pushback.
Forward outlook
- Local home prices are declining (-3.0%/yr); year-one equity from $519 of loan paydown is wiped out by about $2k of value loss. Plan a longer hold.
- Benton County population projected at +32% by 2050 — long-run rental-demand tailwind backs the buy-and-hold thesis.
- At projected returns (-3.0% appreciation + 3.0% rent growth), your $21k cash investment doubles in ~3 years — after that, you're playing with house money.
Negotiation context
- It's been on market 55 days — a 3% lower offer ($73k) is reasonable based on typical stale-listing flexibility.
- 2 sale attempts since 8y ago with the ask held roughly flat each time — persistent listings suggest the price (not the market) is what's stuck; bring a comps-based counter.
Questions for the listing agent
- It's been on market 55 days. Have you received any prior offers? Is the seller open to a 3% concession, seller financing, or rate buy-down credit?
- Is there a deadline driving the sale (1031 exchange, divorce, estate, relocation)? That informs how much negotiation room exists.
- Schools are D-rated, which usually means shorter tenancies and higher turnover. Who's the typical renter profile here, and what's been the actual vacancy rate?
- Crime grade is F in this area — have there been break-ins, vandalism, or insurance claims at this property in the last 3 years? What carrier currently insures it and at what premium?
- What's the average days-on-market for RENTAL listings here right now (not sales)? A rising rental-DOM trend means longer vacancies and softer asking-rent achievability than the comps imply.
- What's the recent tenant-quality profile in this submarket — average credit score on applications, eviction rate, late-payment / NSF rate, and stable-employment percentage? A property-management company in the area should have these aggregated.
- How much new for-sale + rental construction is in the pipeline within 1–3 miles? Heavy new supply typically softens prices + rents 12–24 months out; constrained supply supports both.
Investment metrics
- 1% rule
- 2.04% ✓
- Cap rate
- 18.54%
- Cash-on-cash
- 43.74%
- DSCR
- 2.95
- GRM
- 4.1
CMA / ARV
- ARV (median comp)
- $83,978
- List price
- $75,000
- Delta
- -10.69%
- Verdict
- UNDERPRICED
- Comps
- 12 within 1.0 mi
Show comp detail 10 sales within ~0.75 mi
| Address | Dist | Beds/Ba | Sqft | Sold | Price | $/sf | Match |
|---|---|---|---|---|---|---|---|
| 3324 19th Ave #88 Ave #88 | 0.12mi | 2/2.0 | 924 (0%) | 6mo | $15,000 | $16 | 90 |
| 3324 W 19th Ave #191 | 0.24mi | 2/2.0 | 924 (0%) | 4mo | $67,000 | $73 | 86 |
| 3324 W 19th Ave #81 | 0.09mi | 2/1.0 | 924 (0%) | 13mo | $70,000 | $76 | 81 |
| 3324 W 19th Ave #109 | 0.04mi | 2/2.0 | 980 (+6%) | 12mo | $78,000 | $80 | 78 |
| 3324 W 19th Ave #146 | 0.08mi | 2/1.0 | 924 (0%) | 23mo | $68,000 | $74 | 73 |
| 2906 W 7th Ave #23 | 0.60mi | 2/2.0 | 924 (0%) | 7mo | $62,500 | $68 | 66 |
| 2917 W 19th Avenue, #1 Ave #1 | 0.32mi | 2/1.0 | 840 (-9%) | 2mo | $75,000 | $89 | 64 |
| 3324 W 19th Ave #45 | 0.26mi | 2/1.0 | 896 (-3%) | 20mo | $71,000 | $79 | 62 |
| 2917 W 19th Ave #22 | 0.53mi | 2/2.0 | 1,002 (+8%) | 1mo | $95,000 | $95 | 61 |
| 2917 W 19th Ave, #17 Ave #17 | 0.48mi | 2/2.0 | 924 (0%) | 21mo | $20,000 | $22 | 60 |
Match score weights: distance 35% · size 25% · config 20% · recency 20%. Top-matched comps best support the ARV.
Projected returns pro-forma
-3.0% appreciation · 3.0% rent growth · sell at horizon
- IRR
- 40.6%
- Equity multiple
- 2.74×
- Total profit
- $36,573
- Equity at exit
- $11,183
- IRR
- 46.9%
- Equity multiple
- 5.50×
- Total profit
- $94,526
- Equity at exit
- $6,485
Cash invested: $21,000 (down + closing). Projections, not guarantees.
Landlord ↔ Tenant lean methodology
- Overall (STATE)
- 28 Tenant-Leaning
- State Washington
- 28 Tenant-Leaning · D+8
- County
- — inherits STATE
- City
- — inherits STATE
ZIP-level market 99338
- Active inventory
- 311
- Price-to-rent
- 4.1×
Monthly cashflow live
- Estimated rent
- $1,530 high interval (Pro) →
- Mortgage (P&I)
- −$393
- Tax from tax record
- −$19 /mo · $223/yr
- Insurance
- −$31
- HOA
- −$0
- Vacancy / Maint / Mgmt
- −$321
- Net cashflow
- $765
Break-even live
Sensitivity live
| Price | -10% $808 | -5% $787 | +0% $765 | +5% $744 | +10% $723 |
|---|---|---|---|---|---|
| Rent | -10% $645 | -5% $705 | +0% $765 | +5% $826 | +10% $886 |
| Rate | -1.0pp $803 | -0.5pp $784 | base $765 | +0.5pp $746 | +1.0pp $726 |
UW: 25.0% down · 7.5% · 30yr · 1.5% tax · 5.0% vac · 8.0% maint · 8.0% mgmt
Financing live
Cash to close
- Down payment
- $18,750
- Closing costs
- $2,250
- Reserves months
- —
- Total cash needed
- —
Loan-product check · same deal, 3 products live
Conventional
25% down · 7.5% · 30yr
- Down + closing
- —
- Monthly P&I
- —
- Monthly cashflow
- —
- DSCR
- —
- Eligible?
- —
Personal DTI + credit; lowest rate.
DSCR
20% down · 8.5% · 30yr
- Down + closing
- —
- Monthly P&I
- —
- Monthly cashflow
- —
- DSCR
- —
- Eligible?
- —
No personal income docs; deal must DSCR.
Hard money
10% down · 12.0% · 12mo
- Down + closing
- —
- Monthly P&I
- —
- Monthly cashflow
- —
- DSCR
- —
- Eligible?
- —
Short-term bridge; refi at stabilization.
Rent comps 40 comps
| Address | Beds | Baths | Sqft | Rent | $/sqft | DOM | Units | Dist |
|---|---|---|---|---|---|---|---|---|
| 2652 W 15th Ave Kennewick, WA | 2.0–3.0 | 2.0 | 1152 | $1,599 | $1.39 | 15d | 5 | 0.31mi |
| 3611 W 17th Pl Unit A Kennewick, WA | 2.0 | 1.0 | 970 | $1,495 | $1.54 | 22d | 1 | 0.33mi |
| 3113 W 7th Ave Unit D110 Kennewick, WA | 2.0 | 2.5 | 1000 | $1,750 | $1.75 | 15d | 1 | 0.50mi |
| 3426 W 7th Ave Kennewick, WA | 2.0 | 2.0 | 1000 | $1,600 | $1.60 | 22d | 1 | 0.57mi |
| 3426 W 7th Ave Unit A130 Kennewick, WA | 2.0 | 2.0 | 1000 | $1,650 | $1.65 | 45d | 1 | 0.57mi |
| 3708 W 6th Ave Unit B Kennewick, WA | 2.0 | 1.0 | 918 | $1,325 | $1.44 | 45d | 1 | 0.69mi |
| 455 S Morain St Kennewick, WA | 2.0 | 1.0 | 775 | $1,950 | $2.52 | 45d | 1 | 0.73mi |
| 500 S Conway Pl Unit 500 Kennewick, WA | 2.0 | 1.0 | 950 | $1,500 | $1.58 | 45d | 1 | 0.73mi |
| 4112 W 24th Ave Kennewick, WA | 1.0–2.0 | 1.0–2.0 | 681 | $1,875 | $2.75 | 22d | 4 | 0.76mi |
| 337 S Johnson St Unit A Kennewick, WA | 1.0 | 1.0 | 550 | $975 | $1.77 | 45d | 1 | 0.78mi |
| 337 S Johnson St Unit F Kennewick, WA | 1.0 | 1.0 | 550 | $875 | $1.59 | 22d | 1 | 0.78mi |
| 400 S Morain St #7 Kennewick, WA | 3.0 | 2.5 | 1100 | $1,500 | $1.36 | 22d | 1 | 0.79mi |
| 3120 W 4th Ave Kennewick, WA | 2.0 | 1.0 | 963 | $1,550 | $1.61 | 15d | 1 | 0.79mi |
| 3120 W 4th Ave Unit 360 Kennewick, WA | 2.0 | 1.0 | 963 | $1,550 | $1.61 | 45d | 1 | 0.79mi |
| 3120 W 4th Ave Apt 120 Kennewick, WA | 2.0 | 1.0 | 963 | $1,625 | $1.69 | 15d | 1 | 0.79mi |
| 513 S Anderson St Kennewick, WA | 2.0 | 1.0 | 720 | $1,495 | $2.08 | 22d | 1 | 0.80mi |
| 325 S Johnson St Kennewick, WA | 2.0 | 1.5 | 1100 | $1,495 | $1.36 | 45d | 1 | 0.81mi |
| 130 S Conway Pl Kennewick, WA | 2.0 | 1.0 | 852 | $1,299 | $1.52 | 15d | 1 | 0.92mi |
| 1816 W 21st Ave Unit C Kennewick, WA | 3.0 | 2.0 | 1120 | $1,495 | $1.33 | 15d | 1 | 0.94mi |
| E 6th Ave Kennewick, WA | 2.0 | 1.0 | 1100 | $1,500 | $1.36 | 45d | 1 | 1.02mi |
| 12 S Morain St Kennewick, WA | 1.0–3.0 | 1.0 | 604 | $1,249 | $2.07 | 15d | 3 | 1.03mi |
| 119 S Conway Pl Kennewick, WA | 2.0 | 1.0 | 711 | $1,200 | $1.69 | 22d | 1 | 1.03mi |
| 3703 W Kennewick Ave Kennewick, WA | 1.0–2.0 | 1.0 | 782 | $1,594 | $2.04 | 15d | 8 | 1.03mi |
| 1608 W 14th Ave Unit 1614 Kennewick, WA | 2.0 | 1.0 | 750 | $995 | $1.33 | 22d | 1 | 1.12mi |
| 1702 W 7th Pl Unit B Kennewick, WA | 2.0 | 1.0 | 950 | $1,050 | $1.11 | 45d | 1 | 1.17mi |
| 1618 W 7th Pl Unit A Kennewick, WA | 2.0 | 1.0 | 920 | $1,050 | $1.14 | 45d | 1 | 1.18mi |
| 9 N Waverly Pl Kennewick, WA | 1.0 | 1.0 | 600 | $1,222 | $2.04 | 15d | 2 | 1.20mi |
| 4108 W Albany Ave Unit A-D Kennewick, WA | 2.0 | 1.5 | 945 | $1,395 | $1.48 | 45d | 1 | 1.23mi |
| 89 N Waverly Pl Apt E Kennewick, WA | 2.0 | 1.0 | 1000 | $1,250 | $1.25 | 45d | 1 | 1.23mi |
| 1619 W 5th Ave Unit A Kennewick, WA | 2.0 | 1.0 | 981 | $1,450 | $1.48 | 22d | 1 | 1.23mi |
| 200 S Union St Kennewick, WA | 2.0 | 1.0–1.5 | 860 | $1,348 | $1.57 | 15d | 2 | 1.26mi |
| 1110 S Newport St Unit 1110ne B Kennewick, WA | 2.0 | 2.0 | 995 | $1,300 | $1.31 | 45d | 1 | 1.33mi |
| 505 S Olympia St Kennewick, WA | 2.0 | 1.0 | 695 | $1,525 | $2.19 | 45d | 1 | 1.39mi |
| 505 S Olympia St Unit 1326 K3 Kennewick, WA | 3.0 | 1.0 | 945 | $1,650 | $1.75 | 22d | 1 | 1.43mi |
| 505 S Olympia St Apt E4 Kennewick, WA | 2.0 | 1.0 | 695 | $1,285 | $1.85 | 15d | 1 | 1.43mi |
| 505 S Olympia St Apt H1 Kennewick, WA | 3.0 | 1.0 | 890 | $1,675 | $1.88 | 45d | 1 | 1.43mi |
| 1105 W 10th Ave Kennewick, WA | 1.0–2.0 | 1.0 | 687 | $1,306 | $1.90 | 15d | 8 | 1.44mi |
| N Johnson St Kennewick, WA | 2.0 | 1.5 | 1100 | $1,450 | $1.32 | 22d | 3 | 1.45mi |
| 2525 W Grand Ronde Ave Kennewick, WA | 2.0–3.0 | 1.0–2.0 | 1044 | $1,345 | $1.29 | 15d | 4 | 1.45mi |
| 425 S Olympia St Kennewick, WA | 2.0 | 1.0–2.0 | 1000 | $1,335 | $1.33 | 15d | 9 | 1.46mi |
Listing history 2 events
-
2026-03-27$75,000 Active 270-char remark
Show marketing remark (270 chars)
MLS# 291657 Smart home, Alexa will turn on/off all your lights. you can program outside lights, turn off your water sink faucet with a touch. . equipped with security camaras which seller will leave if buyer wants. .seller willl finance with 10k down for 10 or 15 years
-
2018-10-19$45,000
ⓘ Source: listings_history table (triggers on properties + properties_extension) + one-shot
backfill from property_details.listing_events for pre-trigger history.
Tax reassessment forecast WA · Resets to sale price
- Current annual tax
- $223 · $19/mo
- Projected year-2 tax
- $735 · $61/mo
- Expected delta
- +$512/yr (+$43/mo · 229.0%)
ⓘ Screening estimate from a state-policy table — verify with the county assessor before closing.
Climate risk First Street
- Flood 1/10 Low 0% chance over 30 yrs
- Wildfire 4/10 Moderate
- Heat 4/10 Moderate 6 d/yr ≥99°F today · 13 d/yr by 30 yrs out
- Wind 1/10 Low
- Air quality 8/10 Severe 14 unhealthy d/yr today · 15 by 30 yrs out
Nearby sold comps map
Loading sold comps map…
Walkable amenities ~0.75 mi
Loading nearby amenities…
Taxation est. · year 1
- Rental income
- $18,358
- − Mortgage interest
- −$4,201
- − Property taxes
- −$223
- − Insurance
- −$375
- − Repairs & maintenance
- −$1,469
- − Management
- −$1,469
- − Depreciation
- −$2,182
- Taxable income
- $8,440
- Est. tax owed @ 24.0%
- −$2,025
- After-tax cash flow
- $7,159/yr
For passive investors: Depreciation is non-cash, so a rental often shows a tax loss while cash-flowing — sheltering income. Rental losses are passive: they offset passive income freely, and up to $25,000/yr can offset ordinary (W-2) income if you actively participate and your MAGI is under $100k (phasing out to $0 by $150k); unused losses carry forward. On sale, claimed depreciation is recaptured at up to 25%, and gains may owe capital-gains tax (a 1031 exchange can defer both). Figures are a year-1 estimate at your 24.0% rate — not tax advice; consult a CPA.
Schools (NCES district)
- District
- Kennewick School District
- NCES district ID
- 5303930
- Math proficiency
- 43% ▼ -1.00%
- Reading proficiency
- 58% ▬ 0.00%
- Median HH income
- $54,191
- Composite
- 45.56/100
- National rank
- #5667
- State rank
- #141 of 291 in WA
Livability — Kennewick
- Score
- 78/100
- State rank
- #131
- US rank
- #2599
Category grades
Schools grade is shown separately in the Schools card above.
Census & demographics
- Census place
- Kennewick, WA
- County
- Benton County · 186,895 people
- City population
- 104,655
- Metro
- Kennewick-Richland, WA
- Population (ZIP)
- 20,633
- Household income
- $111,042
- Rent vs Own
- Severe rent burden
- 281.0
Population outlook (Benton County) Hauer SSP2
- Today (2025)
- 219,421 people
- By 2030
- 233,813 · +6.6%
- By 2040
- 262,134 · +19.5%
- By 2050
- 290,100 · +32.2%
- By 2075
- 363,525 · +65.7%
- By 2100
- 418,667 · +90.8%
Race, ethnicity, and origin ACS 2023
- Neighborhood character
- Predominantly White (74%)
- Race & ethnicity
- White 74% Hispanic / Latino 16% Two or more races 10% Black 2% Asian 2%
- Hispanic origin (detail)
- Mexican 15%
- Common ancestry
- Portuguese 3% Slovak 3% Iranian 2%
- Foreign-born
- 9% · Canada
- Languages at home
- 83% English-only · Spanish 10% Arabic 2% Other Indo-European 1%
Political lean MEDSL · Benton
- 2024 margin
- Strong R (+21.9) · D 37.7% · R 59.6% · Other 2.7%
- 2008→2024 swing
- +4.2pp toward D · 2008: -26.1pp · 2024: -21.9pp
- All cycles
- 2024: R+21.9 2020: R+21.0 2016: R+26.6 2012: R+27.0 2008: R+26.1
Not yet ingested
- Civics
- —
Market trends
- HPI YoY
- ▼ -167.63%
- Current HPI
- 229.7474
- Rent YoY
- —
- Metro
- Kennewick-Richland, WA
- State GDP YoY
- ▲ 4.65%
- F500 in state
- 22
Industry mix (Fortune 500 HQ in WA)
| Industry | F500 HQs | Revenue |
|---|---|---|
| Retail | 2 | $269B |
|
||
| Technology / Retail | 1 | $638B |
|
||
| Technology | 1 | $245B |
|
||
| Telecommunications | 1 | $38B |
|
||
| Food / Beverage | 1 | $36B |
|
||
| Automotive / Trucks | 1 | $34B |
|
||
Price history
+66.7% since first listed2 events — show timeline
- 2026-03-27 Listed $75,000 PACMLS
- 2018-10-19 Listed $45,000 PACMLS
Property tax history
+7.2%/yrLatest (2026): $223 · -5.7% YoY. Source: county tax records.
Cash-flow waterfall
monthlySold comps — $/sqft
last 12 mo · ≤1 miLoading sold comps…