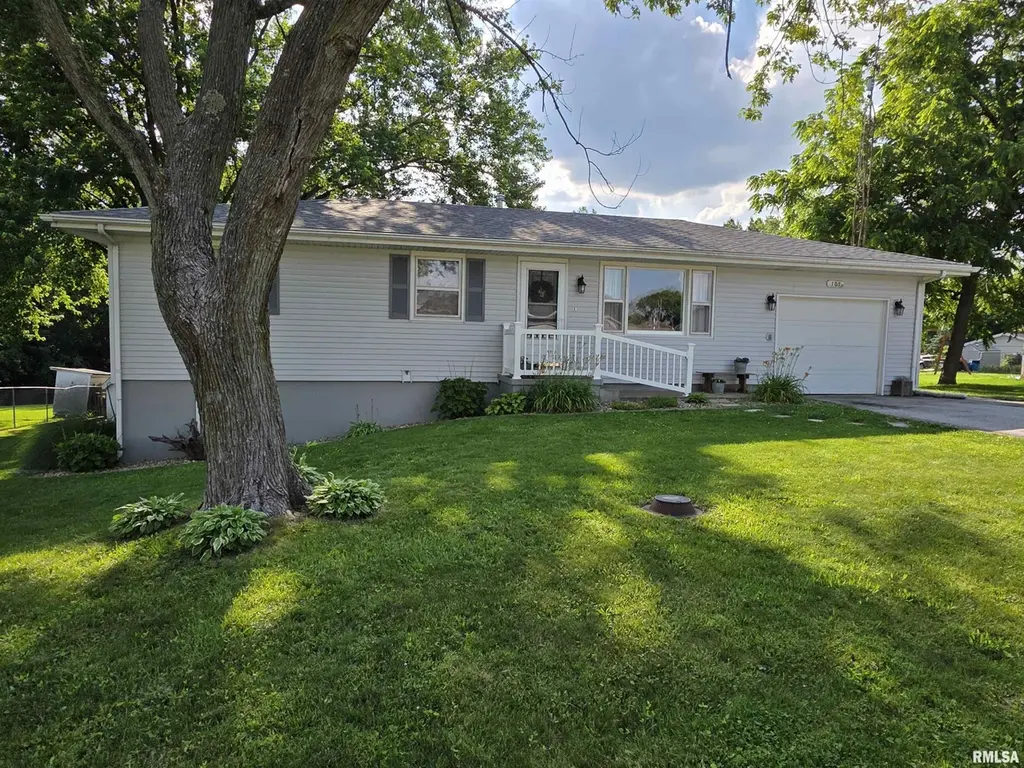
105 Jones St
Woodson, IL 62695
$168,900D+
4 bd · 2.0 ba ·
2,080 sqft ·
Built 1971
· SingleFamily
· Pending
· 2 DOM
Cashflow @ list (25.0% down · 7.5%)
Estimated rent
$1,419/mo
Mortgage (P&I)
−$886
Tax + insurance
−$268
HOA
−$0
Vac / Maint / Mgmt
−$298
Net cashflow
$-32/mo
Annual
$-385/yr
Cap rate
6.06%
Cash-on-cash
-0.81%
DSCR
0.96
1% rule
0.84%
Cash to close
$47,292
Investor read
- This is a 4-bed/2.0-bath single-family listed at $169k.
- At list price, monthly cash flow is $-32 ($-385/yr) — negative.
- To cash-flow at today's rent, offer at most $163k (3.4% below list).
- To meet the 1% rule (rent ≥ 1% of price), the offer needs to be $142k (16.0% below list).
- Only 2 days on market — expect competitive offers; lowballing is unlikely to land.
- Recommended offer: $142k (16.0% below list) — sets the bar for 1% rule.
- In year one you build about $5k of equity ($1k loan paydown + $4k appreciation (2.3% local appreciation)).
- Location reads 64/100 on livability (#716 in IL) — a middle-class / working-renter tenant base. Strengths: cost of living A+, housing A+, employment B+; Watch: crime C-, amenities F, commute F.
- Jacksonville SD 117 (town): math 20% / reading 23% proficiency, ranked #407 of 620 in IL (top 66%) — low school quality limits family demand, transient renter base, plan for 1-2y turnover.
- Zoned schools: Murrayville-Woodson Elem School (math 24% / reading 34%, grade F, #658 of 2,056 statewide, top 35%, 125 students, 0% FRL); Jacksonville Middle School (math 17% / reading 19%, grade F, #444 of 665 statewide, top 67%, 718 students, 0% FRL); Jacksonville High School (math 21% / reading 25%, grade F, #312 of 693 statewide, top 46%, 893 students, 0% FRL) — zoned schools average 0% FRL vs 51% district-wide (51 pts lower); this property's tenant base skews higher-income than the district average.
- Market conditions: 3 active listings in the ZIP; 3 units permitted in Morgan County in 2024 (0 in 5+ unit buildings).
- Morgan County population projected at -20% by 2050 — secular population decline; favor cash flow + early exit over multi-decade hold.
- 2 sale attempts since 11y ago with the ask held roughly flat each time — persistent listings suggest the price (not the market) is what's stuck; bring a comps-based counter.
- Current owner paid $85k; list at $169k implies a 99% gain — meaningful room to come down on a strong offer.
- At projected returns (2.3% appreciation + 3.0% rent growth), your $47k cash investment doubles in ~8 years — after that, you're playing with house money.
- By year 7, paydown + projected appreciation supports a ~$32k cash-out refi (75% LTV) — recoverable capital for the next deal without selling this one.
Questions for listing agent
- What do current leases actually rent for vs. the listed asking? Can we see a recent rent roll and the last 12 months of T-12 income?
- Built in 1971 — when were the roof, HVAC, electrical panel, plumbing, and water heater last replaced?
- Is there a deadline driving the sale (1031 exchange, divorce, estate, relocation)? That informs how much negotiation room exists.
- Schools are D-rated, which usually means shorter tenancies and higher turnover. Who's the typical renter profile here, and what's been the actual vacancy rate?
- The area grade is low — what's the realistic commute time and amenity access for the typical tenant pool here? Any planned neighborhood developments (good or bad) we should know about?
- What's the average days-on-market for RENTAL listings here right now (not sales)? A rising rental-DOM trend means longer vacancies and softer asking-rent achievability than the comps imply.
- What's the recent tenant-quality profile in this submarket — average credit score on applications, eviction rate, late-payment / NSF rate, and stable-employment percentage? A property-management company in the area should have these aggregated.
- How much new for-sale + rental construction is in the pipeline within 1–3 miles? Heavy new supply typically softens prices + rents 12–24 months out; constrained supply supports both.
CashFlowRE · CFR-FJAY3212CV083H
· Data 2 weeks ago
cashflowre.app · 2026-05-29