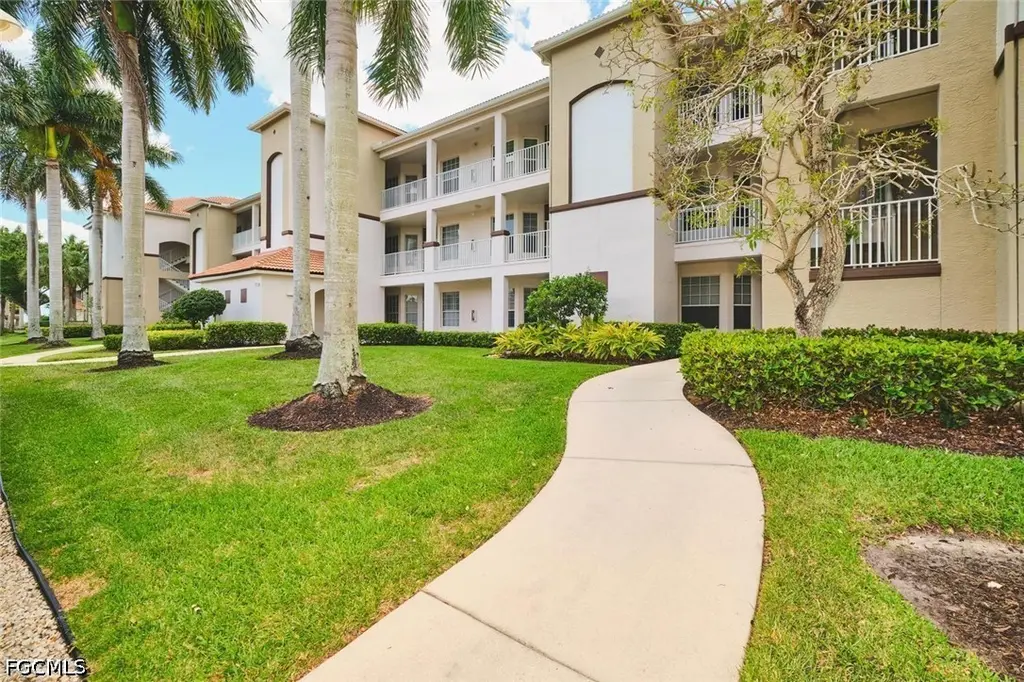
17110 Bridgestone Ct #203
Harlem Heights, FL 33908
$209,900D+
2 bd · 2.0 ba ·
1,175 sqft ·
Built 1999
· Condo
· Active
· 56 DOM
Cashflow @ list (25.0% down · 7.5%)
Estimated rent
$3,670/mo
Mortgage (P&I)
−$1,101
Tax + insurance
−$758
HOA
−$1,411
Vac / Maint / Mgmt
−$771
Net cashflow
$-371/mo
Annual
$-4,449/yr
Cap rate
6.61%
Cash-on-cash
1.14%
DSCR
1.05
1% rule
1.75%
Cash to close
$58,772
Investor read
- This is a 2-bed/2.0-bath condo listed at $210k.
- At list price, monthly cash flow is $-371 ($-4k/yr) — negative.
- To cash-flow at today's rent, offer at most $144k (31.2% below list).
- Meets the 1% rule at list price ($4k rent vs $210k).
- It's been on market 56 days — a 3% lower offer ($204k) is reasonable based on typical stale-listing flexibility.
- Recommended offer: $144k (31.2% below list) — sets the bar for cash-flow.
- Local home prices are declining (-3.0%/yr); year-one equity from $1k of loan paydown is wiped out by about $6k of value loss. Plan a longer hold.
- Location reads 75/100 on livability (#263 in FL, #4,209 nationally) — a middle-class / working-renter tenant base. Strengths: crime A+, cost of living A+, health & safety A+; Watch: schools F, amenities F, employment F.
- Lee (suburban): math 47% / reading 50% proficiency, ranked #42 of 73 in FL (top 58%) — families likely to look elsewhere, expect single-tenant / working-renter base with shorter leases.
- Watch-outs: flood insurance adds $427/mo; HOA is 38% of rent.
- Market conditions: Rents soft (-1.2%/yr); 1244 active listings in the ZIP; 16 comparable units currently listed for rent nearby; rentals at typical pace (median 15d on market — plan ~3-4 weeks tenant-placement turnaround); solid renter incomes; 15,411 units permitted in Lee County in 2024 (4,686 in 5+ unit buildings).
- Lee County population projected at +44% by 2050 — long-run rental-demand tailwind backs the buy-and-hold thesis.
- Climate carrying-cost: in FEMA flood zone AE (mandatory federal flood insurance); severe wind risk, 99% chance of damaging wind over 30y; extreme-heat days projected 7→29/yr by 2055 (HVAC capex compounding) — expect insurance premiums to compound above CPI over the hold.
- Cap rate 6.6% vs local median 2.9% in Harlem Heights — top-decile yield for the area; either an underpriced asset or a hidden risk that comps aren't pricing in. Stress-test before assuming the spread holds.
- At $3,670/mo this rent would consume 58% of the median local household income ($75k/yr) (locally 1944% of renters already pay >50% of income on rent) — very limited rent-growth headroom before tenants either downsize or default.
Questions for listing agent
- What do current leases actually rent for vs. the listed asking? Can we see a recent rent roll and the last 12 months of T-12 income?
- It's been on market 56 days. Have you received any prior offers? Is the seller open to a 31% concession, seller financing, or rate buy-down credit?
- What's the actual annual flood-insurance premium (NFIP or private), and is the property in a SFHA with mandatory coverage?
- What does the HOA fee cover, when was the last increase, and are there any pending special assessments or reserve-fund shortfalls?
- Any open or pending special assessments — roof, HVAC, plumbing, elevator, façade? What's the per-unit balance and payoff schedule, and is the seller paying it off at close or rolling it to the buyer?
- Is there a deadline driving the sale (1031 exchange, divorce, estate, relocation)? That informs how much negotiation room exists.
- Schools are F-rated, which usually means shorter tenancies and higher turnover. Who's the typical renter profile here, and what's been the actual vacancy rate?
- The area grade is low — what's the realistic commute time and amenity access for the typical tenant pool here? Any planned neighborhood developments (good or bad) we should know about?
CashFlowRE · CFR-FJDX741DCVTWWV
· Data 3 days ago
cashflowre.app · 2026-05-29