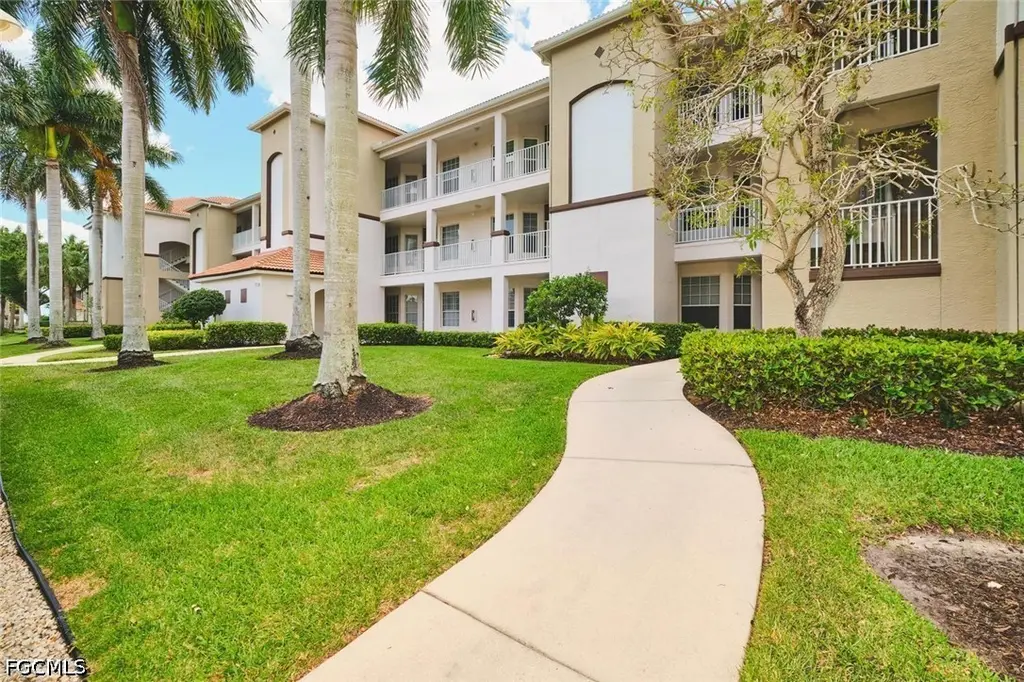
17110 Bridgestone Ct #203 · Harlem Heights, FL
Flood risk 8/10 · Major
- FEMA flood zone
- AE
- Chance of flooding over 30 yrs
- 0.97%
- Est. flood insurance / yr
- $1,737 – $8,500
Fire risk 4/10 · Minor
- Est. fire insurance / yr
- $947 – $1,759
Heat risk 10/10 · Severe
- Hot days now (above 107°F)
- 7 days/yr
- Hot days in 30 yrs
- 29 days/yr
Wind risk 10/10 · Severe
- Chance of severe wind over 30 yrs
- 99.0%
Air-quality risk 2/10 · Minimal
- Unhealthy air days now
- 1 days/yr
- Unhealthy air days in 30 yrs
- 1 days/yr
Risk factors via First Street. Map © Google.
Why this score? — see what drove the D+ grade
The composite is a weighted blend of 9 inputs, each scored 0–100. Each bar is that input's sub-score; the figure is the points it added to the 100-point composite (weight × sub-score).
- Cash flow +14.8/30.0
- 1% rule +10.0/10.0
- ARV discount +7.5/15.0
- DSCR +4.5/10.0
- Schools +4.1/10.0
- Livability +3.8/5.0
- Condition / age +2.5/5.0
- Rent growth +2.2/5.0
- Appreciation +0.0/10.0
$209,900
🖨 Deal sheet 📄 Offer letter ✓ Due diligence
Listing remarks
2nd floor Sutton Walk Lakeside condo located in Lexington Country Club's Lake Village. Pay as you play golf. Stunning lake, fountain and preserve views from the lanai. Views of the Fort Myers Beach skyline from this "Hampton" floor plan. A short walk to the Sutton Walk pool. This unit is in move in condition with lots of upgrades. Air handler was replaced in 2019 and the comdesner was replaced in 2023. LVT flooring in the living room. dining room and master bedroom and bathroom. Tile flooring in the kitchen and entry. Crown moldings. Quartz counters, updated lighting and lighted mirrors in the master. Newer range, dishawahser and washing machine. No see-um screening and so much mo
Key facts
- Fountain views
- Preserve views
- Lake views
Tags
Property features AI
Finance
- Financial info: Pets allowed with conditions (call); maximum of 2 pets
- HOA & community: Homeowners association; Quarterly association fee (listed); Association covers cable TV, golf, insurance, internet, legal/accounting, grounds maintenance, pest control, reserve fund, and sewer; Community amenities: beach rights, bocce court, clubhouse, fitness center, golf course, library, barbecue, picnic area, pickleball, pool, restaurant, sidewalks, pickleball, tennis courts, and management; Community has elevators and gated access; Community size: 1,479 units
Exterior
- Parking: Detached carport; 1 covered space; Has carport (1 space)
- Security: Fire sprinkler system; Smoke detectors
- Utilities: Cable available; Public water; Public sewer
- Home design: 3 stories; Tile roof; Block, concrete, and stucco construction; Entry level is 2; Resale property; Faces east
- Construction: Built with block, concrete and stucco; Tile roof
- Exterior features: Lanai; Porch; Screened porch; Community pool; Reclaimed water irrigation; Rectangular lot; Private road; Private maintained road; West exposure; Has view; Waterfront on lake
Interior
- Kitchen: Refrigerator; Range; Microwave; Dishwasher; Disposal; Breakfast bar; Pantry; Eat-in kitchen
- Bedrooms: Split bedroom layout
- Flooring: Tile; Vinyl
- Bathrooms: 2 full bathrooms; Separate shower (shower only noted)
- Heating & cooling: Central heating (electric); Central air; Ceiling fans; Electric cooling
- Interior features: Furnished; Breakfast bar; Eat-in kitchen; Living/dining room; Pantry; Separate shower; Shower only; Window treatments; High-speed internet; Split bedrooms; Single-hung windows; Window coverings
- Laundry & utility: Washer; Dryer
Neighborhood map
What this means for you Summary
Snapshot
- This is a 2-bed/2.0-bath condo listed at $210k.
Deal economics
- At list price, monthly cash flow is $-371 ($-4k/yr) — negative.
- To cash-flow at today's rent, offer at most $144k (31.2% below list).
- Meets the 1% rule at list price ($4k rent vs $210k).
- Recommended offer: $144k (31.2% below list) — sets the bar for cash-flow.
- Cap rate 6.6% vs local median 2.9% in Harlem Heights — top-decile yield for the area; either an underpriced asset or a hidden risk that comps aren't pricing in. Stress-test before assuming the spread holds.
Location & tenants
- Location reads 75/100 on livability (#263 in FL, #4,209 nationally) — a middle-class / working-renter tenant base. Strengths: crime A+, cost of living A+, health & safety A+; Watch: schools F, amenities F, employment F.
- Lee (suburban): math 47% / reading 50% proficiency, ranked #42 of 73 in FL (top 58%) — families likely to look elsewhere, expect single-tenant / working-renter base with shorter leases.
- Market conditions: Rents soft (-1.2%/yr); 1244 active listings in the ZIP; 16 comparable units currently listed for rent nearby; rentals at typical pace (median 14d on market — plan ~3-4 weeks tenant-placement turnaround); solid renter incomes; 15,411 units permitted in Lee County in 2024 (4,686 in 5+ unit buildings).
- At $3,670/mo this rent would consume 58% of the median local household income ($75k/yr) (locally 1944% of renters already pay >50% of income on rent) — very limited rent-growth headroom before tenants either downsize or default.
Forward outlook
- Local home prices are declining (-3.0%/yr); year-one equity from $1k of loan paydown is wiped out by about $6k of value loss. Plan a longer hold.
- Lee County population projected at +44% by 2050 — long-run rental-demand tailwind backs the buy-and-hold thesis.
Negotiation context
- It's been on market 56 days — a 3% lower offer ($204k) is reasonable based on typical stale-listing flexibility.
Risks & watch-outs
- Watch-outs: flood insurance adds $427/mo; HOA is 38% of rent.
- Climate carrying-cost: in FEMA flood zone AE (mandatory federal flood insurance); severe wind risk, 99% chance of damaging wind over 30y; extreme-heat days projected 7→29/yr by 2055 (HVAC capex compounding) — expect insurance premiums to compound above CPI over the hold.
Questions for the listing agent
- What do current leases actually rent for vs. the listed asking? Can we see a recent rent roll and the last 12 months of T-12 income?
- It's been on market 56 days. Have you received any prior offers? Is the seller open to a 31% concession, seller financing, or rate buy-down credit?
- What's the actual annual flood-insurance premium (NFIP or private), and is the property in a SFHA with mandatory coverage?
- What does the HOA fee cover, when was the last increase, and are there any pending special assessments or reserve-fund shortfalls?
- Any open or pending special assessments — roof, HVAC, plumbing, elevator, façade? What's the per-unit balance and payoff schedule, and is the seller paying it off at close or rolling it to the buyer?
- Is there a deadline driving the sale (1031 exchange, divorce, estate, relocation)? That informs how much negotiation room exists.
- Schools are F-rated, which usually means shorter tenancies and higher turnover. Who's the typical renter profile here, and what's been the actual vacancy rate?
- The area grade is low — what's the realistic commute time and amenity access for the typical tenant pool here? Any planned neighborhood developments (good or bad) we should know about?
- What's the average days-on-market for RENTAL listings here right now (not sales)? A rising rental-DOM trend means longer vacancies and softer asking-rent achievability than the comps imply.
- What's the recent tenant-quality profile in this submarket — average credit score on applications, eviction rate, late-payment / NSF rate, and stable-employment percentage? A property-management company in the area should have these aggregated.
- How much new apartment / multifamily construction is in the pipeline within 1–3 miles? Heavy new supply (>2% of stock underway) typically softens rents 12–24 months out; light construction supports rent growth.
Investment metrics
- 1% rule
- 1.75% ✓
- Cap rate
- 6.61%
- Cash-on-cash
- 1.14%
- DSCR
- 1.05
- GRM
- 4.8
CMA / ARV
No comps found within radius.
Projected returns pro-forma
-3.0% appreciation · 0.0% rent growth · sell at horizon
- IRR
- -38.2%
- Equity multiple
- -0.14×
- Total profit
- $-67,206
- Equity at exit
- $31,297
- IRR
- —
- Equity multiple
- -1.14×
- Total profit
- $-125,722
- Equity at exit
- $18,148
Cash invested: $58,772 (down + closing). Projections, not guarantees.
Landlord ↔ Tenant lean methodology
- Overall (STATE)
- 87 Strongly Landlord-Friendly
- State Florida
- 87 Strongly Landlord-Friendly · R+3
- County
- — inherits STATE
- City
- — inherits STATE
ZIP-level market 33908
- Home prices YoY
- -32.8%
- Rents YoY
- -1.2%
- Active inventory
- 1244
- Price-to-rent
- 4.8×
Monthly cashflow live
- Estimated rent
- $3,670 high interval (Pro) →
- Mortgage (P&I)
- −$1,101
- Tax from tax record
- −$244 /mo · $2,929/yr
- Insurance
- −$87
- Flood insurance flood zone
- −$427 /mo · $5,118/yr
- HOA
- −$1,411
- Vacancy / Maint / Mgmt
- −$771
- Net cashflow
- $-371
Break-even live
UW: 25.0% down · 7.5% · 30yr · 1.5% tax · 5.0% vac · 8.0% maint · 8.0% mgmt
Financing live
Cash to close
- Down payment
- $52,475
- Closing costs
- $6,297
- Reserves months
- —
- Total cash needed
- —
Loan-product check · same deal, 3 products live
Conventional
25% down · 7.5% · 30yr
- Down + closing
- —
- Monthly P&I
- —
- Monthly cashflow
- —
- DSCR
- —
- Eligible?
- —
Personal DTI + credit; lowest rate.
DSCR
20% down · 8.5% · 30yr
- Down + closing
- —
- Monthly P&I
- —
- Monthly cashflow
- —
- DSCR
- —
- Eligible?
- —
No personal income docs; deal must DSCR.
Hard money
10% down · 12.0% · 12mo
- Down + closing
- —
- Monthly P&I
- —
- Monthly cashflow
- —
- DSCR
- —
- Eligible?
- —
Short-term bridge; refi at stabilization.
Rent comps 16 comps
| Address | Beds | Baths | Sqft | Rent | $/sqft | DOM | Units | Dist |
|---|---|---|---|---|---|---|---|---|
| 17100 Bridgestone Ct #303 Fort Myers, FL | 2.0 | 2.0 | 1175 | $4,575 | $3.89 | 14d | 1 | 0.02mi |
| 17120 Bridgestone Ct #104 Fort Myers, FL | 2.0 | 2.0 | 1282 | $2,400 | $1.87 | 23d | 1 | 0.08mi |
| 17120 Bridgestone Ct #104 Fort Myers, FL | 2.0 | 2.0 | 1175 | $2,400 | $2.04 | 3d | 1 | 0.08mi |
| 8837 E Bay Cir Fort Myers, FL | 2.0 | 2.0 | 1156 | $2,600 | $2.25 | 23d | 1 | 0.21mi |
| 9140 Southmont Cv #102 Fort Myers, FL | 3.0 | 2.0 | 1331 | $2,500 | $1.88 | 14d | 1 | 0.21mi |
| 17020 Willowcrest Way Fort Myers, FL | 2.0–3.0 | 2.0 | 1344 | $2,500 | $1.86 | 15d | 2 | 0.28mi |
| 9190 Southmont Cv #309 Fort Myers, FL | 3.0 | 2.0 | 1331 | $6,500 | $4.88 | 1d | 1 | 0.32mi |
| 9170 Southmont Cv Fort Myers, FL | 2.0–3.0 | 2.0 | 1358 | $4,725 | $3.48 | 14d | 1 | 0.36mi |
| 16491 Millstone Cir #207 Fort Myers, FL | 2.0 | 2.0 | 1348 | $2,000 | $1.48 | 14d | 1 | 0.54mi |
| 17006 Middlebrook Ct Fort Myers, FL | 2.0 | 2.0 | 1247 | $6,300 | $5.05 | 14d | 1 | 0.58mi |
| 17006 Middlebrook Ct Fort Myers, FL | 2.0 | 2.0 | 1498 | $6,300 | $4.21 | 15d | 1 | 0.58mi |
| 16481 Millstone Cir #207 Fort Myers, FL | 3.0 | 2.0 | 1348 | $2,700 | $2.00 | 23d | 1 | 0.58mi |
| 16471 Millstone Cir #303 Fort Myers, FL | 2.0 | 2.0 | 1068 | $6,100 | $5.71 | 14d | 1 | 0.62mi |
| 16440 Millstone Cir #203 Fort Myers, FL | 2.0 | 2.0 | 1067 | $6,300 | $5.90 | 14d | 1 | 0.79mi |
| 16421 Millstone Cir Fort Myers, FL | 2.0 | 2.0 | 1068 | $4,400 | $4.12 | 15d | 2 | 0.80mi |
| 16430 Millstone Cir #103 Fort Myers, FL | 2.0 | 2.0 | 1067 | $6,300 | $5.90 | 14d | 1 | 0.82mi |
HOA detail condo
- Monthly dues
- $1,411 · $16,932/yr
- Likely covers
- pool
- Assessments
- None detected in remarks — confirm with the listing agent.
Listing history 13 events
-
2026-06-17days on market $209,900 Active 56 DOM
-
2026-06-16days on market $209,900 Active 55 DOM
-
2026-06-15days on market $209,900 Active 54 DOM
-
2026-06-13days on market $209,900 Active 52 DOM
-
2026-06-10days on market $209,900 Active 49 DOM
-
2026-06-09days on market $209,900 Active 48 DOM
-
2026-06-07days on market $209,900 Active 46 DOM
-
2026-06-03days on market $209,900 Active 42 DOM
-
2026-06-02days on market $209,900 Active 41 DOM
-
2026-06-01days on market $209,900 Active 40 DOM
-
2026-05-31days on market $209,900 Active 39 DOM
-
2026-05-11price $209,900
-
2026-04-22$219,900 Active
ⓘ Source: listings_history table (triggers on properties + properties_extension) + one-shot
backfill from property_details.listing_events for pre-trigger history.
Tax reassessment forecast FL · Resets to sale price
- Current annual tax
- $2,929 · $244/mo
- Projected year-2 tax
- $2,929 · $244/mo
- Expected delta
- $0/yr ($0/mo · 0.0%)
ⓘ Screening estimate from a state-policy table — verify with the county assessor before closing.
Climate risk First Street
- Flood 8/10 Severe FEMA zone AE · 97% chance over 30 yrs
- Wildfire 4/10 Moderate
- Heat 10/10 Extreme 7 d/yr ≥107°F today · 29 d/yr by 30 yrs out
- Wind 10/10 Extreme 99% chance of damaging wind over 30 yrs
- Air quality 2/10 Low 1 unhealthy d/yr today · 1 by 30 yrs out
Nearby sold comps map
Loading sold comps map…
Walkable amenities ~0.75 mi
Loading nearby amenities…
Taxation est. · year 1
- Rental income
- $44,036
- − Mortgage interest
- −$11,758
- − Property taxes
- −$2,929
- − Insurance
- −$6,168
- − Repairs & maintenance
- −$3,523
- − Management
- −$3,523
- − HOA
- −$16,932
- − Depreciation
- −$6,106
- Taxable loss
- −$6,902
- Est. tax savings @ 24.0%
- +$1,656
- After-tax cash flow
- $-2,792/yr
For passive investors: Depreciation is non-cash, so a rental often shows a tax loss while cash-flowing — sheltering income. Rental losses are passive: they offset passive income freely, and up to $25,000/yr can offset ordinary (W-2) income if you actively participate and your MAGI is under $100k (phasing out to $0 by $150k); unused losses carry forward. On sale, claimed depreciation is recaptured at up to 25%, and gains may owe capital-gains tax (a 1031 exchange can defer both). Figures are a year-1 estimate at your 24.0% rate — not tax advice; consult a CPA.
Schools (NCES district)
- District
- Lee
- NCES district ID
- 1201080
- Math proficiency
- 47% ▼ -11.00%
- Reading proficiency
- 50% ▼ -4.00%
- Median HH income
- $49,518
- Composite
- 41.49/100
- National rank
- #3458
- State rank
- #42 of 73 in FL
Livability — Harlem Heights
- Score
- 75/100
- State rank
- #263
- US rank
- #4209
Category grades
Schools grade is shown separately in the Schools card above.
Census & demographics
- County
- Lee County · 788,662 people
- City population
- 27,337
- Metro
- Cape Coral-Fort Myers, FL
- Population (ZIP)
- 37,423
- Household income
- $75,396
- Rent vs Own
- Severe rent burden
- 1944.0
Population outlook (Lee County) Hauer SSP2
- Today (2025)
- 871,946 people
- By 2030
- 955,468 · +9.6%
- By 2040
- 1,113,587 · +27.7%
- By 2050
- 1,256,891 · +44.1%
- By 2075
- 1,560,270 · +78.9%
- By 2100
- 1,726,848 · +98.0%
Race, ethnicity, and origin ACS 2023
- Neighborhood character
- Predominantly White (88%)
- Race & ethnicity
- White 88% Hispanic / Latino 6% Two or more races 5% Black 3% Asian 1%
- Hispanic origin (detail)
- Mexican 1% Puerto Rican 2%
- Common ancestry
- Romanian 5% Lithuanian 4% Slovak 3%
- Foreign-born
- 10% · Canada, Jamaica
- Languages at home
- 90% English-only · Spanish 4% Russian/Polish/Slavic 1% Other Indo-European 1%
Political lean MEDSL · Lee
- 2024 margin
- Strong R (+28.4) · D 35.5% · R 63.9%
- 2008→2024 swing
- -18.0pp toward R · 2008: -10.4pp · 2024: -28.4pp
- All cycles
- 2024: R+28.4 2020: R+19.2 2016: R+20.4 2012: R+16.6 2008: R+10.4
Not yet ingested
- Civics
- —
Market trends
- HPI YoY
- ▼ -102.22%
- Current HPI
- 209.7595
- Rent YoY
- ▼ -1.18%
- Metro
- Cape Coral-Fort Myers, FL
- State GDP YoY
- ▲ 3.28%
- F500 in state
- 36
Industry mix (Fortune 500 HQ in FL)
| Industry | F500 HQs | Revenue |
|---|---|---|
| Industrial Technology | 2 | $29B |
|
||
| Insurance | 2 | $17B |
|
||
| Retail | 1 | $60B |
|
||
| Technology Distribution | 1 | $58B |
|
||
| Homebuilding | 1 | $35B |
|
||
| Technology Manufacturing | 1 | $35B |
|
||
Price history
-4.5% since first listed2 events — show timeline
- 2026-05-11 Price Changed $209,900 FORTMLS
- 2026-04-22 Listed $219,900 FORTMLS
Property tax history
+2.9%/yrLatest (2025): $2,929 · -5.3% YoY. Source: county tax records.
Cash-flow waterfall
monthlySold comps — $/sqft
last 12 mo · ≤1 miLoading sold comps…