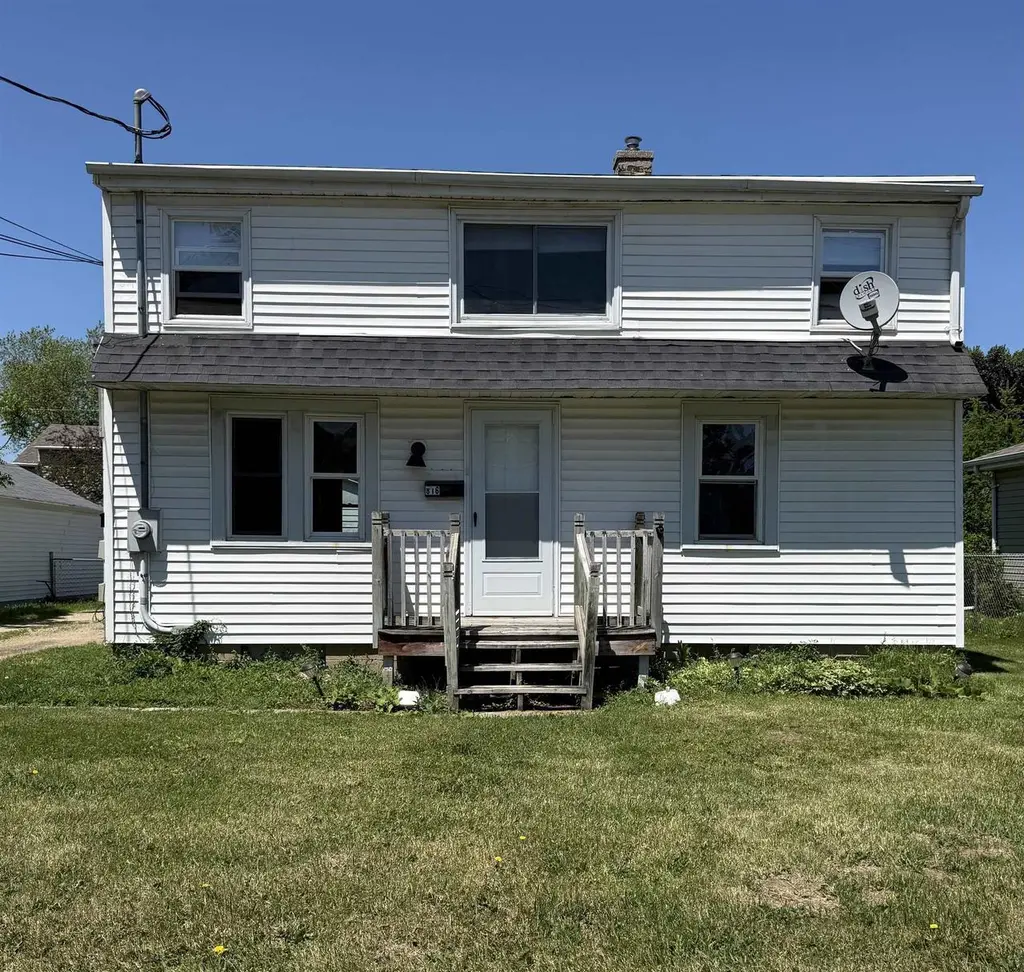
816 Roosevelt St
Menasha, WI 54952
$169,900B
3 bd · 2.0 ba ·
1,183 sqft ·
Built 1940
· MultiFamily
· Active
· 11 DOM
Cashflow @ list (25.0% down · 7.5%)
Estimated rent
$2,594/mo
Mortgage (P&I)
−$891
Tax + insurance
−$248
HOA
−$0
Vac / Maint / Mgmt
−$545
Net cashflow
$910/mo
Annual
$10,925/yr
Cap rate
12.72%
Cash-on-cash
22.97%
DSCR
2.02
1% rule
1.53%
Cash to close
$47,572
Investor read
- This is a 2 × 3-bed/2.0-bath units multifamily listed at $170k.
- At list price, monthly cash flow is $910 ($11k/yr) — positive. Per door: $455/mo.
- The deal already cash-flows at list — no discount required.
- Meets the 1% rule at list price ($3k rent vs $170k).
- Only 11 days on market — expect competitive offers; lowballing is unlikely to land.
- In year one you build about $18k of equity ($1k loan paydown + $17k appreciation (10.0% local appreciation)).
- Location reads 80/100 on livability (#59 in WI, #1,628 nationally) — a professional / high-income tenant draw. Strengths: commute A+, cost of living A+, housing A+; Watch: employment C-, schools D, amenities D.
- Menasha Joint School District (suburban): math 30% / reading 24% proficiency, ranked #300 of 342 in WI (top 88%) — low school quality limits family demand, transient renter base, plan for 1-2y turnover.
- Watch-outs: built in 1940 — expect roof / HVAC / electrical / plumbing capex.
- Market conditions: Rents rising fast (+4.6%/yr); 69 active listings in the ZIP; 14 comparable units currently listed for rent nearby; rentals at typical pace (median 22d on market — plan ~3-4 weeks tenant-placement turnaround); 652 units permitted in Winnebago County in 2024 (333 in 5+ unit buildings).
- Winnebago County population projected at +3% by 2050 — modest demand growth; plan on rents tracking national, not racing it.
- At projected returns (10.0% appreciation + 4.6% rent growth), your $48k cash investment doubles in ~2 years — after that, you're playing with house money.
- By year 3, paydown + projected appreciation supports a ~$46k cash-out refi (75% LTV) — recoverable capital for the next deal without selling this one.
- Cap rate 12.7% vs local median 2.5% in Menasha — top-decile yield for the area; either an underpriced asset or a hidden risk that comps aren't pricing in. Stress-test before assuming the spread holds.
- This rent runs 45% of the median local income ($69k/yr) — at the standard rent-burdened threshold; future hikes will face affordability resistance.
Questions for listing agent
- Can we see the unit-by-unit rent roll, current vacancy, and any below-market leases? What's the average tenancy length?
- What capital expenditures (roof, boiler, parking lot, exteriors) have been made in the last 5 years, and what's planned in the next 2?
- Built in 1940 — when were the roof, HVAC, electrical panel, plumbing, and water heater last replaced?
- Is there a deadline driving the sale (1031 exchange, divorce, estate, relocation)? That informs how much negotiation room exists.
- Schools are D-rated, which usually means shorter tenancies and higher turnover. Who's the typical renter profile here, and what's been the actual vacancy rate?
- What's the average days-on-market for RENTAL listings here right now (not sales)? A rising rental-DOM trend means longer vacancies and softer asking-rent achievability than the comps imply.
- What's the recent tenant-quality profile in this submarket — average credit score on applications, eviction rate, late-payment / NSF rate, and stable-employment percentage? A property-management company in the area should have these aggregated.
- How much new apartment / multifamily construction is in the pipeline within 1–3 miles? Heavy new supply (>2% of stock underway) typically softens rents 12–24 months out; light construction supports rent growth.
CashFlowRE · CFR-FJM2XG26S3EH4X
· Data 1 day ago
cashflowre.app · 2026-05-29