 Duplex
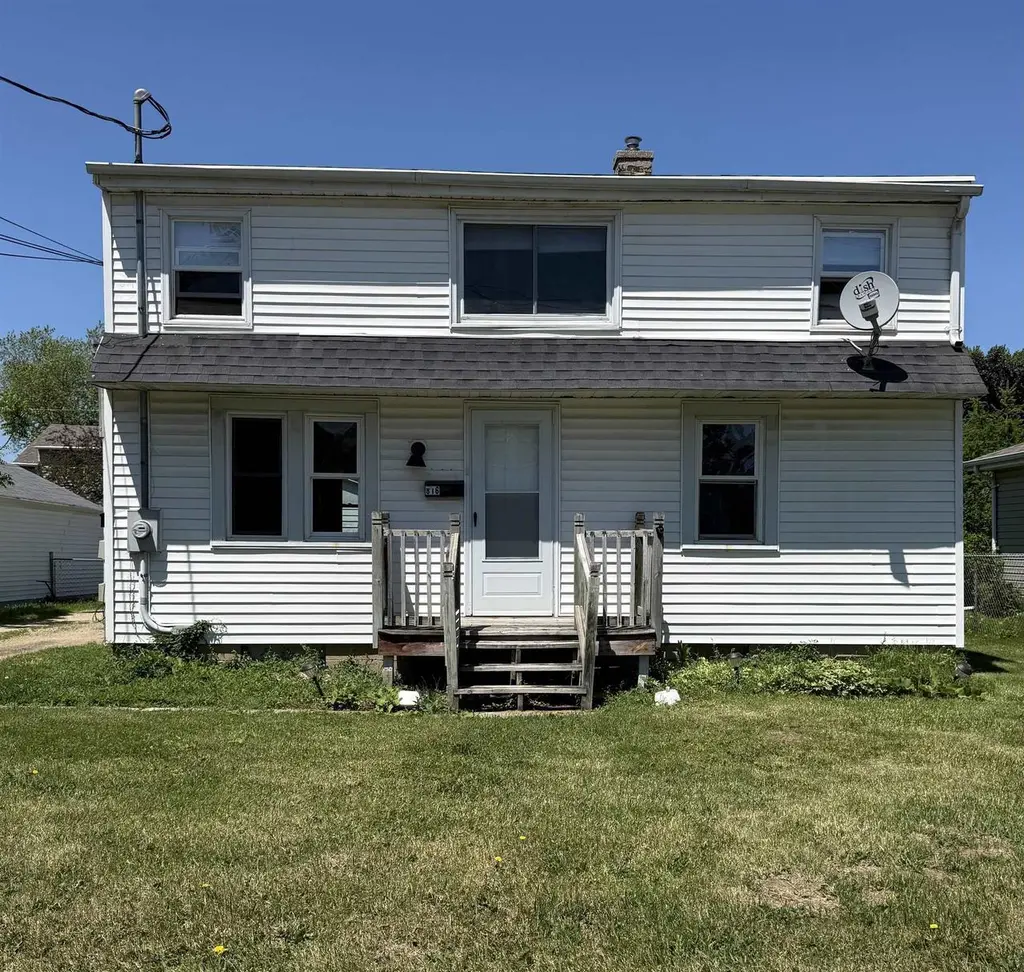
816 Roosevelt St · Menasha, WI
Flood risk 1/10 · Minimal
- FEMA flood zone
- X (unshaded)
- Chance of flooding over 30 yrs
- 0.0%
- Est. flood insurance / yr
- $473 – $860
Fire risk 1/10 · Minimal
- Est. fire insurance / yr
- $636 – $1,182
Heat risk 2/10 · Minimal
- Hot days now (above 97°F)
- 7 days/yr
- Hot days in 30 yrs
- 13 days/yr
Wind risk 2/10 · Minimal
- Chance of severe wind over 30 yrs
- —
Air-quality risk 2/10 · Minimal
- Unhealthy air days now
- 1 days/yr
- Unhealthy air days in 30 yrs
- 2 days/yr
Risk factors via First Street. Map © Google.
Why this score? — see what drove the B grade
The composite is a weighted blend of 9 inputs, each scored 0–100. Each bar is that input's sub-score; the figure is the points it added to the 100-point composite (weight × sub-score).
- Cash flow +30.0/30.0
- 1% rule +10.0/10.0
- DSCR +10.0/10.0
- Appreciation +10.0/10.0
- Livability +4.0/5.0
- Rent growth +3.7/5.0
- Condition / age +2.5/5.0
- Schools +2.3/10.0
- ARV discount +1.6/15.0
$169,900
🖨 Deal sheet (PDF) 📄 Offer letter ✓ Due diligence
Multi-family units
County records classify this as Multi-Family (2-4 Unit). Listing-text estimate: 2 units. confirmed
Listing remarks
* * Investor Opportunity in Menasha! * * Well-maintained duplex that's ready to add to your investment portfolio. This fully rented property offers immediate cash flow with reliable tenants already in place. Recent updates provide added value and peace of mind, making this a low-maintenance investment for both new & seasoned investors. Each unit offers comfortable living spaces with functional layouts that appeal to renters, while the property's convenient Menasha location provides easy access to schools, parks, shopping, dining, & major commuter routes. Whether you're looking to expand your rental portfolio or purchase your first investment property, this cute duplex checks a
Key facts
- Recent updates
- Functional layouts
- 4,791 sq ft lot
Tags
Property features AI
Finance
- Other: Two-unit building (duplex) — Unit 1 approx. 676 sq. ft.; Unit 2 approx. 380 sq. ft.
Exterior
- Parking: Outside parking
- Utilities: Municipal water; Municipal sewer
- Home design: Multi-family property; 1.5-story / bi-level design; Estimated total living area between 1,001 and 1,250 sq. ft.
- Construction: Information source for year built: Assessor/Public Record
- Exterior features: Vinyl exterior; Lot under 1/2 acre (approx. 0.11 acre); Zoned for 2-family/duplex
Interior
- Kitchen: Unit 2 kitchen approx. 16 x 10
- Bedrooms: Unit 1 has 2 bedrooms; Unit 2 has 1 bedroom (master approx. 9 x 12)
- Bathrooms: Unit 1 has 1 full bathroom; Unit 2 has 1 full bathroom
- Heating & cooling: Forced air heating; Natural gas heating
- Interior features: Full block basement
Neighborhood map
What this means for you Summary
Snapshot
- This is a 2 × 3-bed/2.0-bath units multifamily listed at $170k.
Deal economics
- At list price, monthly cash flow is $910 ($11k/yr) — positive. Per door: $455/mo.
- The deal already cash-flows at list — no discount required.
- Meets the 1% rule at list price ($3k rent vs $170k).
- Cap rate 12.7% vs local median 2.5% in Menasha — top-decile yield for the area; either an underpriced asset or a hidden risk that comps aren't pricing in. Stress-test before assuming the spread holds.
Location & tenants
- Location reads 80/100 on livability (#59 in WI, #1,628 nationally) — a professional / high-income tenant draw. Strengths: commute A+, cost of living A+, housing A+; Watch: employment C-, schools D, amenities D.
- Menasha Joint School District (suburban): math 30% / reading 24% proficiency, ranked #300 of 342 in WI (top 88%) — low school quality limits family demand, transient renter base, plan for 1-2y turnover.
- Market conditions: Rents rising fast (+4.6%/yr); 69 active listings in the ZIP; 14 comparable units currently listed for rent nearby; rentals at typical pace (median 22d on market — plan ~3-4 weeks tenant-placement turnaround); 652 units permitted in Winnebago County in 2024 (333 in 5+ unit buildings).
- This rent runs 45% of the median local income ($69k/yr) — at the standard rent-burdened threshold; future hikes will face affordability resistance.
Forward outlook
- In year one you build about $18k of equity ($1k loan paydown + $17k appreciation (10.0% local appreciation)).
- Winnebago County population projected at +3% by 2050 — modest demand growth; plan on rents tracking national, not racing it.
- At projected returns (10.0% appreciation + 4.6% rent growth), your $48k cash investment doubles in ~2 years — after that, you're playing with house money.
- By year 3, paydown + projected appreciation supports a ~$46k cash-out refi (75% LTV) — recoverable capital for the next deal without selling this one.
Negotiation context
- Only 11 days on market — expect competitive offers; lowballing is unlikely to land.
Risks & watch-outs
- Watch-outs: built in 1940 — expect roof / HVAC / electrical / plumbing capex.
Questions for the listing agent
- Can we see the unit-by-unit rent roll, current vacancy, and any below-market leases? What's the average tenancy length?
- What capital expenditures (roof, boiler, parking lot, exteriors) have been made in the last 5 years, and what's planned in the next 2?
- Built in 1940 — when were the roof, HVAC, electrical panel, plumbing, and water heater last replaced?
- Is there a deadline driving the sale (1031 exchange, divorce, estate, relocation)? That informs how much negotiation room exists.
- Schools are D-rated, which usually means shorter tenancies and higher turnover. Who's the typical renter profile here, and what's been the actual vacancy rate?
- What's the average days-on-market for RENTAL listings here right now (not sales)? A rising rental-DOM trend means longer vacancies and softer asking-rent achievability than the comps imply.
- What's the recent tenant-quality profile in this submarket — average credit score on applications, eviction rate, late-payment / NSF rate, and stable-employment percentage? A property-management company in the area should have these aggregated.
- How much new apartment / multifamily construction is in the pipeline within 1–3 miles? Heavy new supply (>2% of stock underway) typically softens rents 12–24 months out; light construction supports rent growth.
Investment metrics
- 1% rule
- 1.53% ✓
- Cap rate
- 12.72%
- Cash-on-cash
- 22.97%
- DSCR
- 2.02
- GRM
- 5.5
CMA / ARV
- ARV (on-the-fly)
- $150,241
- Comps found
- 1
Show comp detail 1 sale within ~0.75 mi
| Address | Dist | Beds/Ba | Sqft | Sold | Price | $/sf | Match |
|---|---|---|---|---|---|---|---|
| 531 1st St | 0.60mi | 3/2.0 | 1,180 (-0%) | 16mo | $150,000 | $127 | 58 |
Match score weights: distance 35% · size 25% · config 20% · recency 20%. Top-matched comps best support the ARV.
Projected returns pro-forma
10.0% appreciation · 4.62% rent growth · sell at horizon
- IRR
- 42.4%
- Equity multiple
- 4.25×
- Total profit
- $154,833
- Equity at exit
- $153,059
- IRR
- 37.3%
- Equity multiple
- 9.82×
- Total profit
- $419,703
- Equity at exit
- $330,078
Cash invested: $47,572 (down + closing). Projections, not guarantees.
Landlord ↔ Tenant lean methodology
- Overall (STATE)
- 73 Landlord-Friendly
- State Wisconsin
- 73 Landlord-Friendly · R+2
- County
- — inherits STATE
- City
- — inherits STATE
ZIP-level market 54952
- Home prices YoY
- 7.2%
- Rents YoY
- 4.6%
- Active inventory
- 69
- Price-to-rent
- 10.9×
Monthly cashflow live
- Estimated rent
- $2,594 medium interval (Pro) →
- Mortgage (P&I)
- −$891
- Tax from tax record
- −$177 /mo · $2,125/yr
- Insurance
- −$71
- HOA
- −$0
- Vacancy / Maint / Mgmt
- −$545
- Net cashflow
- $910
Break-even live
Sensitivity live
| Price | -10% $1,007 | -5% $959 | +0% $910 | +5% $862 | +10% $814 |
|---|---|---|---|---|---|
| Rent | -10% $706 | -5% $808 | +0% $910 | +5% $1,013 | +10% $1,115 |
| Rate | -1.0pp $996 | -0.5pp $954 | base $910 | +0.5pp $866 | +1.0pp $822 |
2-unit breakdown (identical units grouped — click to expand)
| Units | Beds | Baths | Est. rent |
|---|---|---|---|
| 2× units | 3 | 2 | $2,594 |
| #1 | 3 | 2 | $1,297 |
| #2 | 3 | 2 | $1,297 |
| Total (2 units) | $2,594 | ||
UW: 25.0% down · 7.5% · 30yr · 1.5% tax · 5.0% vac · 8.0% maint · 8.0% mgmt
Financing live
Cash to close
- Down payment
- $42,475
- Closing costs
- $5,097
- Reserves months
- —
- Total cash needed
- —
Loan-product check · same deal, 3 products live
Conventional
25% down · 7.5% · 30yr
- Down + closing
- —
- Monthly P&I
- —
- Monthly cashflow
- —
- DSCR
- —
- Eligible?
- —
Personal DTI + credit; lowest rate.
DSCR
20% down · 8.5% · 30yr
- Down + closing
- —
- Monthly P&I
- —
- Monthly cashflow
- —
- DSCR
- —
- Eligible?
- —
No personal income docs; deal must DSCR.
Hard money
10% down · 12.0% · 12mo
- Down + closing
- —
- Monthly P&I
- —
- Monthly cashflow
- —
- DSCR
- —
- Eligible?
- —
Short-term bridge; refi at stabilization.
Rent comps 14 comps
| Address | Beds | Baths | Sqft | Rent | $/sqft | DOM | Units | Dist |
|---|---|---|---|---|---|---|---|---|
| 239 Edgewater Dr Unit 1061617P Menasha, WI | 3.0 | 2.0 | 1194 | $3,253 | $2.72 | 13d | 1 | 0.92mi |
| 460 Ahnaip St Unit 301 Menasha, WI | 2.0 | 1.0 | 970 | $1,600 | $1.65 | 21d | 1 | 0.93mi |
| 945 Tayco St Unit 941-05 Menasha, WI | 2.0 | 1.0 | 1006 | $1,149 | $1.14 | 21d | 1 | 1.00mi |
| 945 Tayco St Menasha, WI | 2.0 | 1.0 | 1006 | $1,149 | $1.14 | 14d | 1 | 1.00mi |
| 1 Main St Unit 208 Menasha, WI | 2.0 | 2.0 | 1046 | $1,600 | $1.53 | 21d | 1 | 1.08mi |
| 1 Main St Unit 201 Menasha, WI | 2.0 | 1.0 | 966 | $1,500 | $1.55 | 21d | 1 | 1.08mi |
| 1 Main St Unit 301 Menasha, WI | 2.0 | 1.0 | 966 | $1,550 | $1.60 | 21d | 1 | 1.08mi |
| 1 Main St Unit 312 Menasha, WI | 2.0 | 2.0 | 1209 | $1,700 | $1.41 | 21d | 1 | 1.08mi |
| 1 Main St Unit 401 Menasha, WI | 2.0 | 1.5 | 1142 | $1,625 | $1.42 | 21d | 1 | 1.09mi |
| 1263 Manitowoc Rd #3 Menasha, WI | 2.0 | 1.0 | 750 | $825 | $1.10 | 21d | 1 | 1.13mi |
| 1300 Geneva Rd Unit 1320-03 Menasha, WI | 2.0 | 1.0 | 930 | $1,259 | $1.35 | 14d | 1 | 1.26mi |
| 1000 Lucerne Dr Menasha, WI | 1.0–3.0 | 1.0 | 962 | $1,599 | $1.66 | 14d | 34 | 1.29mi |
| 1300 Lucerne Dr Unit 1340-06 Menasha, WI | 2.0 | 2.0 | 1100 | $1,239 | $1.13 | 21d | 1 | 1.44mi |
| 413 Green St Neenah, WI | 2.0 | 2.0 | 1250 | $1,550 | $1.24 | 21d | 1 | 1.47mi |
Listing history 8 events
-
2026-06-19days on market $169,900 Active 11 DOM
-
2026-06-18days on market $169,900 Active 10 DOM
-
2026-06-17days on market $169,900 Active 9 DOM
-
2026-06-16days on market $169,900 Active 8 DOM
-
2026-06-15days on market $169,900 Active 7 DOM
-
2026-06-14days on market $169,900 Active 5 DOM
-
2026-06-13remarks 691-char remark
-
2026-06-13$169,900 Active 4 DOM
ⓘ Source: listings_history table (triggers on properties + properties_extension) + one-shot
backfill from property_details.listing_events for pre-trigger history.
Tax reassessment forecast WI · Partial reset (capped growth)
- Current annual tax
- $2,125 · $177/mo
- Projected year-2 tax
- $2,634 · $219/mo
- Expected delta
- +$509/yr (+$42/mo · 24.0%)
ⓘ Screening estimate from a state-policy table — verify with the county assessor before closing.
Climate risk First Street
- Flood 1/10 Low FEMA zone X (unshaded) · 0% chance over 30 yrs
- Wildfire 1/10 Low
- Heat 2/10 Low 7 d/yr ≥97°F today · 13 d/yr by 30 yrs out
- Wind 2/10 Low
- Air quality 2/10 Low 1 unhealthy d/yr today · 2 by 30 yrs out
Nearby sold comps map
Loading sold comps map…
Walkable amenities ~0.75 mi
Loading nearby amenities…
Taxation est. · year 1
- Rental income
- $31,128
- − Mortgage interest
- −$9,517
- − Property taxes
- −$2,125
- − Insurance
- −$850
- − Repairs & maintenance
- −$2,490
- − Management
- −$2,490
- − Depreciation
- −$4,943
- Taxable income
- $8,714
- Est. tax owed @ 24.0%
- −$2,091
- After-tax cash flow
- $8,834/yr
For passive investors: Depreciation is non-cash, so a rental often shows a tax loss while cash-flowing — sheltering income. Rental losses are passive: they offset passive income freely, and up to $25,000/yr can offset ordinary (W-2) income if you actively participate and your MAGI is under $100k (phasing out to $0 by $150k); unused losses carry forward. On sale, claimed depreciation is recaptured at up to 25%, and gains may owe capital-gains tax (a 1031 exchange can defer both). Figures are a year-1 estimate at your 24.0% rate — not tax advice; consult a CPA.
Schools (NCES district)
- District
- Menasha Joint School District
- NCES district ID
- 5509030
- Math proficiency
- 30% ▼ -10.00%
- Reading proficiency
- 24% ▼ -7.00%
- Median HH income
- $44,188
- Composite
- 23.19/100
- National rank
- #7945
- State rank
- #300 of 342 in WI
Livability — Menasha
- Score
- 80/100
- State rank
- #59
- US rank
- #1628
Category grades
Schools grade is shown separately in the Schools card above.
Census & demographics
- Census place
- Menasha, WI
- County
- Winnebago County · 155,689 people
- Metro
- Oshkosh-Neenah, WI
- Population (ZIP)
- 27,312
- Household income
- $69,196
- Rent vs Own
- Severe rent burden
- 636.0
Population outlook (Winnebago County) Hauer SSP2
- Today (2025)
- 175,480 people
- By 2030
- 177,928 · +1.4%
- By 2040
- 180,873 · +3.1%
- By 2050
- 181,302 · +3.3%
- By 2075
- 184,071 · +4.9%
- By 2100
- 175,932 · +0.3%
Race, ethnicity, and origin ACS 2023
- Neighborhood character
- Predominantly White (81%)
- Race & ethnicity
- White 81% Hispanic / Latino 11% Two or more races 8% Asian 2%
- Hispanic origin (detail)
- Mexican 8% Puerto Rican 3%
- Common ancestry
- Romanian 6% Iranian 4% Portuguese 4%
- Foreign-born
- 5% · Canada, China
- Languages at home
- 91% English-only · Spanish 6% Other Asian/Pacific 1%
Political lean MEDSL · Winnebago
- 2024 margin
- Toss-up / Even · D 46.9% · R 51.7% · Other 1.4%
- 2008→2024 swing
- -16.4pp toward R · 2008: 11.7pp · 2024: -4.8pp
- All cycles
- 2024: R+4.8 2020: R+4.0 2016: R+7.4 2012: D+3.8 2008: D+11.7
Not yet ingested
- Civics
- —
Market trends
- HPI YoY
- ▲ 30.18%
- Current HPI
- 446.39
- Rent YoY
- ▲ 4.62%
- Metro
- Oshkosh-Neenah, WI
- State GDP YoY
- ▲ 2.10%
- F500 in state
- 20
Industry mix (Fortune 500 HQ in WI)
| Industry | F500 HQs | Revenue |
|---|---|---|
| Industrial Machinery | 4 | $23B |
|
||
| Industrial Technology | 2 | $36B |
|
||
| Insurance | 1 | $36B |
|
||
| Professional Services | 1 | $19B |
|
||
| Utilities | 1 | $9B |
|
||
| Consumer Goods | 1 | $3B |
|
||
Price history
1 event — show timeline
- 2026-06-08 Listed $169,900 RANW
Property tax history
+3.2%/yrLatest (2021): $2,125 · +8.7% YoY. Source: county tax records.
Cash-flow waterfall
monthlySold comps — $/sqft
last 12 mo · ≤1 miLoading sold comps…