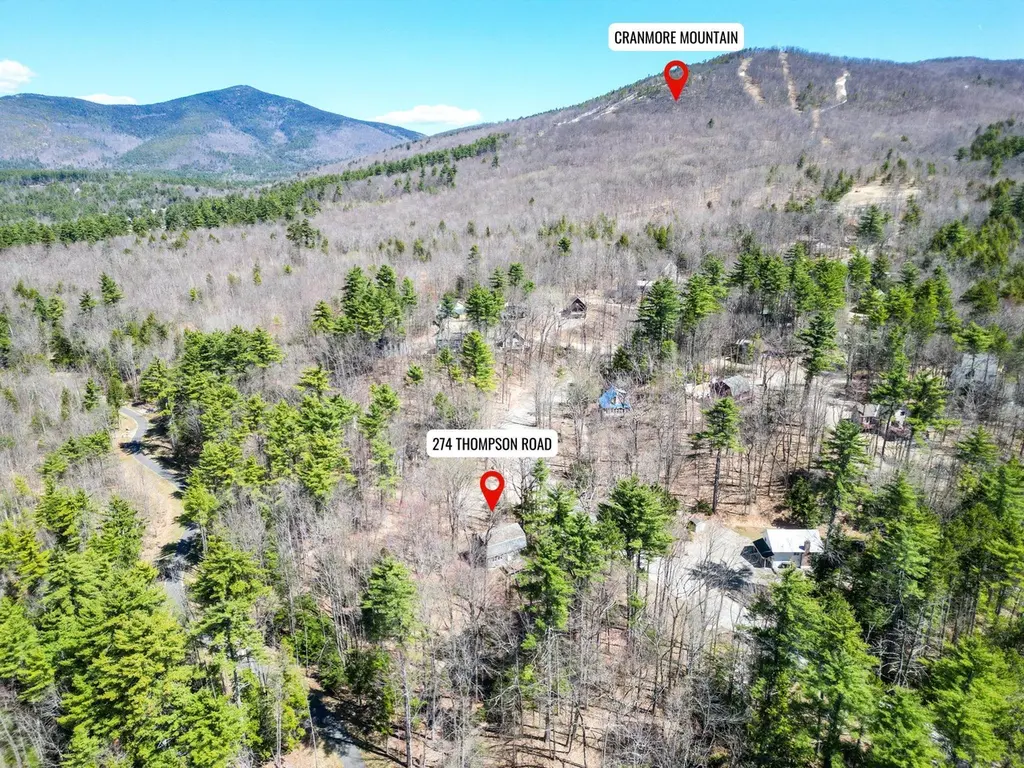
274 Thompson Rd
Conway, NH 03860
$325,000D
4 bd · 2.0 ba ·
1,536 sqft ·
Built 1977
· SingleFamily
· Active
· 52 DOM
Cashflow @ list (25.0% down · 7.5%)
Estimated rent
$2,500/mo
Mortgage (P&I)
−$1,704
Tax + insurance
−$542
HOA
−$0
Vac / Maint / Mgmt
−$525
Net cashflow
$-271/mo
Annual
$-3,252/yr
Cap rate
5.29%
Cash-on-cash
-3.57%
DSCR
0.84
1% rule
0.77%
Cash to close
$91,000
Investor read
- This is a 4-bed/2.0-bath single-family listed at $325k.
- At list price, monthly cash flow is $-271 ($-3k/yr) — negative.
- To cash-flow at today's rent, offer at most $286k (12.1% below list).
- To meet the 1% rule (rent ≥ 1% of price), the offer needs to be $250k (23.1% below list).
- It's been on market 52 days — a 3% lower offer ($315k) is reasonable based on typical stale-listing flexibility.
- Recommended offer: $250k (23.1% below list) — sets the bar for 1% rule.
- Local home prices are declining (-3.0%/yr); year-one equity from $2k of loan paydown is wiped out by about $10k of value loss. Plan a longer hold.
- Location reads 74/100 on livability (#33 in NH, #4,690 nationally) — a middle-class / working-renter tenant base. Strengths: cost of living A+, housing A+, health & safety A+; Watch: employment D, amenities F, commute F.
- Conway School District (rural): math 28% / reading 46% proficiency, ranked #73 of 98 in NH (top 74%) — families likely to look elsewhere, expect single-tenant / working-renter base with shorter leases.
- Zoned schools: John H. Fuller School (math 52% / reading 57%, grade C, #62 of 263 statewide, top 30%, 177 students, 32% FRL); A. Crosby Kennett Middle School (math 22% / reading 44%, grade F, #60 of 96 statewide, top 63%, 235 students, 39% FRL); Kennett High School (math 37% / reading 57%, grade D-, #47 of 90 statewide, top 57%, 706 students, 27% FRL) — zoned schools at 33% FRL track the district average.
- Market conditions: 57 active listings in the ZIP; 1 comparable units currently listed for rent nearby; 357 units permitted in Carroll County in 2024 (0 in 5+ unit buildings).
- Carroll County population projected at -27% by 2050 — secular population decline; favor cash flow + early exit over multi-decade hold.
- Cap rate 5.3% vs local median 3.0% in Conway — top-decile yield for the area; either an underpriced asset or a hidden risk that comps aren't pricing in. Stress-test before assuming the spread holds.
Questions for listing agent
- What do current leases actually rent for vs. the listed asking? Can we see a recent rent roll and the last 12 months of T-12 income?
- It's been on market 52 days. Have you received any prior offers? Is the seller open to a 23% concession, seller financing, or rate buy-down credit?
- Built in 1977 — when were the roof, HVAC, electrical panel, plumbing, and water heater last replaced?
- Is there a deadline driving the sale (1031 exchange, divorce, estate, relocation)? That informs how much negotiation room exists.
- Schools are D-rated, which usually means shorter tenancies and higher turnover. Who's the typical renter profile here, and what's been the actual vacancy rate?
- The area grade is low — what's the realistic commute time and amenity access for the typical tenant pool here? Any planned neighborhood developments (good or bad) we should know about?
- What's the average days-on-market for RENTAL listings here right now (not sales)? A rising rental-DOM trend means longer vacancies and softer asking-rent achievability than the comps imply.
- What's the recent tenant-quality profile in this submarket — average credit score on applications, eviction rate, late-payment / NSF rate, and stable-employment percentage? A property-management company in the area should have these aggregated.
CashFlowRE · CFR-FKD93RDEG0KRDH
· Data 12 h ago
cashflowre.app · 2026-05-29