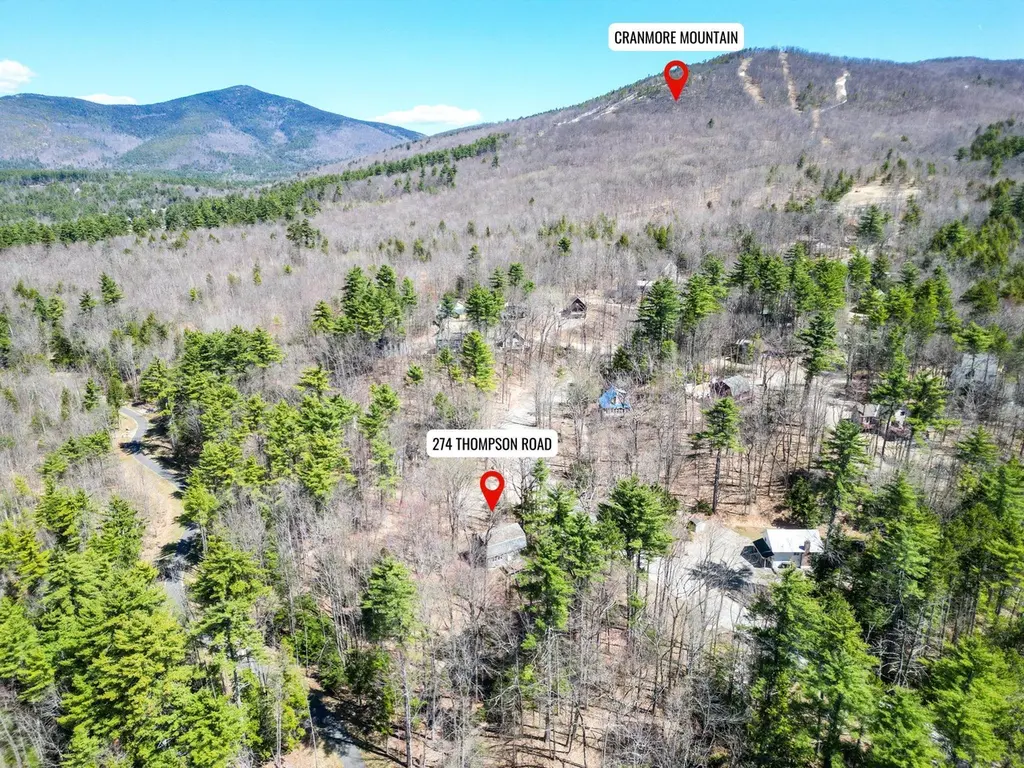
274 Thompson Rd · Conway, NH
Flood risk 1/10 · Minimal
- FEMA flood zone
- X (unshaded)
- Chance of flooding over 30 yrs
- 0.0%
- Est. flood insurance / yr
- $473 – $860
Fire risk 1/10 · Minimal
- Est. fire insurance / yr
- $507 – $941
Heat risk 2/10 · Minimal
- Hot days now (above 94°F)
- 7 days/yr
- Hot days in 30 yrs
- 15 days/yr
Wind risk 3/10 · Minor
- Chance of severe wind over 30 yrs
- 6.0%
Air-quality risk 2/10 · Minimal
- Unhealthy air days now
- 1 days/yr
- Unhealthy air days in 30 yrs
- 1 days/yr
Risk factors via First Street. Map © Google.
Why this score? — see what drove the D grade
The composite is a weighted blend of 9 inputs, each scored 0–100. Each bar is that input's sub-score; the figure is the points it added to the 100-point composite (weight × sub-score).
- ARV discount +15.0/15.0
- Cash flow +8.7/30.0
- Livability +3.7/5.0
- Schools +3.2/10.0
- 1% rule +2.7/10.0
- Rent growth +2.5/5.0
- Condition / age +2.5/5.0
- DSCR +2.4/10.0
- Appreciation +0.0/10.0
$325,000
🖨 Deal sheet (PDF) 📄 Offer letter ✓ Due diligence
Listing remarks
A fantastic opportunity to exercise your design and remodeling skills awaits just outside North Conway Village. Located just off Thompson Road this home was acquired by the state of NH many years for a now abandoned road project and the time has come for it to be sold. The potential here is huge-a level lot in a great neighborhood with a structure that could be rebuilt or replaced to accommodate your family and friends. The recently installed rec path runs through the back of the lot allowing for easy access to Cranmore Mountain, mountain bike trails and hiking to Black Cap. The property has not been inhabited in some time and access inside is strictly not allowed. Offers to be submitted fo
Key facts
- Hiking to black cap
- Level lot
- Mountain bike trails
Tags
Property features AI
Finance
- Other: Easements on the property; Lot number: 262
Exterior
- Parking: Gravel driveway
- Utilities: Electric service at the street; Water source unknown; Sewer unknown; Internet availability unknown; Other utilities listed
- Home design: Gambrel-style home; Existing construction
- Construction: Built in 1977; Wood frame construction; Shingle roof
- Exterior features: Wooded lot with nearby trails and walking paths; Close to shopping, skiing, hospital, and schools; Trail access or near trail
Interior
- Bathrooms: Two full bathrooms
- Heating & cooling: Monitor-type heating; Other cooling
- Interior features: Seven total rooms; Finished basement with walk-up access; Concrete basement
Neighborhood map
What this means for you Summary
Snapshot
- This is a 4-bed/2.0-bath single-family listed at $325k.
Deal economics
- At list price, monthly cash flow is $-271 ($-3k/yr) — negative.
- To cash-flow at today's rent, offer at most $286k (12.1% below list).
- To meet the 1% rule (rent ≥ 1% of price), the offer needs to be $250k (23.1% below list).
- Recommended offer: $250k (23.1% below list) — sets the bar for 1% rule.
- Cap rate 5.3% vs local median 3.0% in Conway — top-decile yield for the area; either an underpriced asset or a hidden risk that comps aren't pricing in. Stress-test before assuming the spread holds.
Location & tenants
- Location reads 74/100 on livability (#33 in NH, #4,690 nationally) — a middle-class / working-renter tenant base. Strengths: cost of living A+, housing A+, health & safety A+; Watch: employment D, amenities F, commute F.
- Conway School District (rural): math 28% / reading 46% proficiency, ranked #73 of 98 in NH (top 74%) — families likely to look elsewhere, expect single-tenant / working-renter base with shorter leases.
- Zoned schools: John H. Fuller School (math 52% / reading 57%, grade C, #62 of 263 statewide, top 30%, 177 students, 32% FRL); A. Crosby Kennett Middle School (math 22% / reading 44%, grade F, #60 of 96 statewide, top 63%, 235 students, 39% FRL); Kennett High School (math 37% / reading 57%, grade D-, #47 of 90 statewide, top 57%, 706 students, 27% FRL) — zoned schools at 33% FRL track the district average.
- Market conditions: 57 active listings in the ZIP; 1 comparable units currently listed for rent nearby; 357 units permitted in Carroll County in 2024 (0 in 5+ unit buildings).
Forward outlook
- Local home prices are declining (-3.0%/yr); year-one equity from $2k of loan paydown is wiped out by about $10k of value loss. Plan a longer hold.
- Carroll County population projected at -27% by 2050 — secular population decline; favor cash flow + early exit over multi-decade hold.
Negotiation context
- It's been on market 52 days — a 3% lower offer ($315k) is reasonable based on typical stale-listing flexibility.
Questions for the listing agent
- What do current leases actually rent for vs. the listed asking? Can we see a recent rent roll and the last 12 months of T-12 income?
- It's been on market 52 days. Have you received any prior offers? Is the seller open to a 23% concession, seller financing, or rate buy-down credit?
- Built in 1977 — when were the roof, HVAC, electrical panel, plumbing, and water heater last replaced?
- Is there a deadline driving the sale (1031 exchange, divorce, estate, relocation)? That informs how much negotiation room exists.
- Schools are D-rated, which usually means shorter tenancies and higher turnover. Who's the typical renter profile here, and what's been the actual vacancy rate?
- The area grade is low — what's the realistic commute time and amenity access for the typical tenant pool here? Any planned neighborhood developments (good or bad) we should know about?
- What's the average days-on-market for RENTAL listings here right now (not sales)? A rising rental-DOM trend means longer vacancies and softer asking-rent achievability than the comps imply.
- What's the recent tenant-quality profile in this submarket — average credit score on applications, eviction rate, late-payment / NSF rate, and stable-employment percentage? A property-management company in the area should have these aggregated.
- How much new for-sale + rental construction is in the pipeline within 1–3 miles? Heavy new supply typically softens prices + rents 12–24 months out; constrained supply supports both.
Investment metrics
- 1% rule
- 0.77% ✗
- Cap rate
- 5.29%
- Cash-on-cash
- -3.57%
- DSCR
- 0.84
- GRM
- 10.8
CMA / ARV
- ARV (median comp)
- $521,784
- List price
- $325,000
- Delta
- -37.71%
- Verdict
- UNDERPRICED
- Comps
- 9 within 1.0 mi
Show comp detail 2 sales within ~0.75 mi
| Address | Dist | Beds/Ba | Sqft | Sold | Price | $/sf | Match |
|---|---|---|---|---|---|---|---|
| 37 Cranmore Rd | 0.64mi | 4/2.0 | 1,570 (+2%) | 13mo | $550,000 | $350 | 56 |
| 131 Grove St | 0.63mi | 3/2.0 (-1) | 1,744 (+14%) | 1mo | $699,000 | $401 | 42 |
Match score weights: distance 35% · size 25% · config 20% · recency 20%. Top-matched comps best support the ARV.
Projected returns pro-forma
-3.0% appreciation · 3.0% rent growth · sell at horizon
- IRR
- -22.3%
- Equity multiple
- 0.23×
- Total profit
- $-69,886
- Equity at exit
- $48,459
- IRR
- -16.3%
- Equity multiple
- 0.09×
- Total profit
- $-82,928
- Equity at exit
- $28,100
Cash invested: $91,000 (down + closing). Projections, not guarantees.
Landlord ↔ Tenant lean methodology
- Overall (STATE)
- 56 Moderately Landlord-Leaning
- State New Hampshire
- 56 Moderately Landlord-Leaning · D+1
- County
- — inherits STATE
- City
- — inherits STATE
ZIP-level market 03860
- Home prices YoY
- -6.1%
- Active inventory
- 57
- Price-to-rent
- 10.8×
Monthly cashflow live
- Estimated rent
- $2,500 medium interval (Pro) →
- Mortgage (P&I)
- −$1,704
- Tax est. 1.5%
- −$406 /mo · $4,875/yr
- Insurance
- −$135
- HOA
- −$0
- Vacancy / Maint / Mgmt
- −$525
- Net cashflow
- $-271
Break-even live
Sensitivity live
| Price | -10% $-46 | -5% $-159 | +0% $-271 | +5% $-383 | +10% $-496 |
|---|---|---|---|---|---|
| Rent | -10% $-469 | -5% $-370 | +0% $-271 | +5% $-172 | +10% $-74 |
| Rate | -1.0pp $-107 | -0.5pp $-188 | base $-271 | +0.5pp $-355 | +1.0pp $-441 |
UW: 25.0% down · 7.5% · 30yr · 1.5% tax · 5.0% vac · 8.0% maint · 8.0% mgmt
Financing live
Cash to close
- Down payment
- $81,250
- Closing costs
- $9,750
- Reserves months
- —
- Total cash needed
- —
Loan-product check · same deal, 3 products live
Conventional
25% down · 7.5% · 30yr
- Down + closing
- —
- Monthly P&I
- —
- Monthly cashflow
- —
- DSCR
- —
- Eligible?
- —
Personal DTI + credit; lowest rate.
DSCR
20% down · 8.5% · 30yr
- Down + closing
- —
- Monthly P&I
- —
- Monthly cashflow
- —
- DSCR
- —
- Eligible?
- —
No personal income docs; deal must DSCR.
Hard money
10% down · 12.0% · 12mo
- Down + closing
- —
- Monthly P&I
- —
- Monthly cashflow
- —
- DSCR
- —
- Eligible?
- —
Short-term bridge; refi at stabilization.
Rent comps 1 comps
| Address | Beds | Baths | Sqft | Rent | $/sqft | DOM | Units | Dist |
|---|---|---|---|---|---|---|---|---|
| 176 Echo Acres Rd North Conway, NH | 3.0 | 3.0 | 1960 | $2,500 | $1.28 | 45d | 1 | 1.36mi |
Listing history 17 events
-
2026-06-21days on market $325,000 Active 52 DOM
-
2026-06-21days on market $325,000 Active 51 DOM
-
2026-06-18days on market $325,000 Active 49 DOM
-
2026-06-17days on market $325,000 Active 48 DOM
-
2026-06-16days on market $325,000 Active 47 DOM
-
2026-06-15days on market $325,000 Active 46 DOM
-
2026-06-13days on market $325,000 Active 44 DOM
-
2026-06-12days on market $325,000 Active 43 DOM
-
2026-06-09days on market $325,000 Active 40 DOM
-
2026-06-08days on market $325,000 Active 39 DOM
-
2026-06-07days on market $325,000 Active 38 DOM
-
2026-06-07days on market $325,000 Active 37 DOM
-
2026-06-04days on market $325,000 Active 34 DOM
-
2026-06-02days on market $325,000 Active 33 DOM
-
2026-06-01days on market $325,000 Active 32 DOM
-
2026-05-31days on market $325,000 Active 31 DOM
-
2026-04-30$325,000 Active 778-char remark
ⓘ Source: listings_history table (triggers on properties + properties_extension) + one-shot
backfill from property_details.listing_events for pre-trigger history.
Climate risk First Street
- Flood 1/10 Low FEMA zone X (unshaded) · 0% chance over 30 yrs
- Wildfire 1/10 Low
- Heat 2/10 Low 7 d/yr ≥94°F today · 15 d/yr by 30 yrs out
- Wind 3/10 Moderate 6% chance of damaging wind over 30 yrs
- Air quality 2/10 Low 1 unhealthy d/yr today · 1 by 30 yrs out
Nearby sold comps map
Loading sold comps map…
Walkable amenities ~0.75 mi
Loading nearby amenities…
Taxation est. · year 1
- Rental income
- $30,000
- − Mortgage interest
- −$18,205
- − Property taxes
- −$4,875
- − Insurance
- −$1,625
- − Repairs & maintenance
- −$2,400
- − Management
- −$2,400
- − Depreciation
- −$9,455
- Taxable loss
- −$8,960
- Est. tax savings @ 24.0%
- +$2,150
- After-tax cash flow
- $-1,102/yr
For passive investors: Depreciation is non-cash, so a rental often shows a tax loss while cash-flowing — sheltering income. Rental losses are passive: they offset passive income freely, and up to $25,000/yr can offset ordinary (W-2) income if you actively participate and your MAGI is under $100k (phasing out to $0 by $150k); unused losses carry forward. On sale, claimed depreciation is recaptured at up to 25%, and gains may owe capital-gains tax (a 1031 exchange can defer both). Figures are a year-1 estimate at your 24.0% rate — not tax advice; consult a CPA.
Schools (NCES district)
- District
- Conway School District
- NCES district ID
- 3302490
- Math proficiency
- 28% ▼ -8.00%
- Reading proficiency
- 46% ▼ -1.00%
- Median HH income
- $49,590
- Composite
- 31.9/100
- National rank
- #5859
- State rank
- #73 of 98 in NH
Livability — Conway
- Score
- 74/100
- State rank
- #33
- US rank
- #4690
Category grades
Schools grade is shown separately in the Schools card above.
Census & demographics
- Population (ZIP)
- 3,780
Population outlook (Carroll County) Hauer SSP2
- Today (2025)
- 45,072 people
- By 2030
- 43,158 · -4.2%
- By 2040
- 38,044 · -15.6%
- By 2050
- 33,087 · -26.6%
- By 2075
- 25,661 · -43.1%
- By 2100
- 18,684 · -58.5%
Race, ethnicity, and origin ACS 2023
- Neighborhood character
- Predominantly White (98%)
- Race & ethnicity
- White 98% Two or more races 2%
- Common ancestry
- Slovak 8% Serbian 7% Lithuanian 5%
- Foreign-born
- 2% · Canada
- Languages at home
- 97% English-only · French/Haitian/Cajun 1% Other Indo-European 1% Spanish 1%
Political lean MEDSL · Carroll
- 2024 margin
- Toss-up / Even · D 48.8% · R 50.5%
- 2008→2024 swing
- -8.0pp toward R · 2008: 6.3pp · 2024: -1.7pp
- All cycles
- 2024: R+1.7 2020: D+1.5 2016: R+5.7 2012: R+0.8 2008: D+6.3
Not yet ingested
- Civics
- —
Market trends
- HPI YoY
- ▼ -25.63%
- Current HPI
- 393.4218
- Rent YoY
- —
- Metro
- —
- State GDP YoY
- —
- F500 in state
- 0
Price history
1 event — show timeline
- 2026-04-30 Listed $325,000 PrimeMLS
Cash-flow waterfall
monthlySold comps — $/sqft
last 12 mo · ≤1 miLoading sold comps…