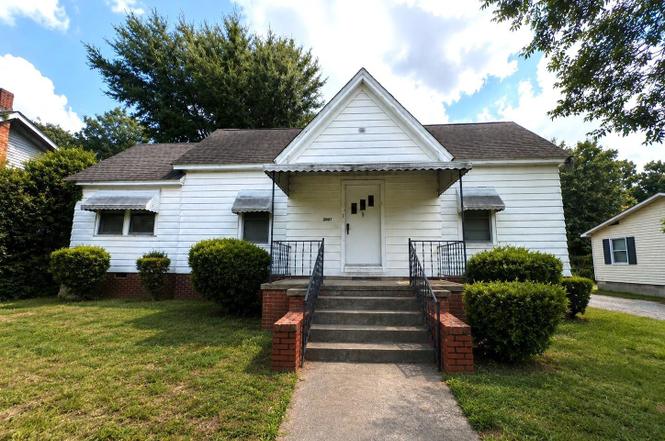
2007 Nance St
Newberry, SC 29108
$89,900C+
2 bd · 1.0 ba ·
1,418 sqft ·
Built 1956
· SingleFamily
· Active
· 3 DOM
Cashflow @ list (25.0% down · 7.5%)
Estimated rent
$1,210/mo
Mortgage (P&I)
−$471
Tax + insurance
−$152
HOA
−$0
Vac / Maint / Mgmt
−$254
Net cashflow
$332/mo
Annual
$3,988/yr
Cap rate
10.73%
Cash-on-cash
15.84%
DSCR
1.70
1% rule
1.35%
Cash to close
$25,172
Investor read
- This is a 2-bed/1.0-bath single-family listed at $90k.
- At list price, monthly cash flow is $332 ($4k/yr) — positive.
- The deal already cash-flows at list — no discount required.
- Meets the 1% rule at list price ($1k rent vs $90k).
- Only 3 days on market — expect competitive offers; lowballing is unlikely to land.
- Local home prices are declining (-3.0%/yr); year-one equity from $622 of loan paydown is wiped out by about $3k of value loss. Plan a longer hold.
- Location reads 67/100 on livability (#91 in SC) — a middle-class / working-renter tenant base. Strengths: cost of living A+, housing A+, health & safety A+; Watch: crime F, amenities F, commute F.
- Newberry 01 (rural): math 32% / reading 40% proficiency, ranked #40 of 80 in SC (top 50%) — families likely to look elsewhere, expect single-tenant / working-renter base with shorter leases; 60% free/reduced lunch — lower-income household profile, screen leases tightly.
- Zoned schools: Newberry High (math 42% / reading 67%, grade C-, #130 of 196 statewide, top 69%, 802 students, 91% FRL) — zoned schools average 91% FRL vs 60% district-wide (31 pts higher); higher-poverty schools than district average — tighter screening recommended.
- Zoned-school proficiency averages 54% at this address vs 36% district-wide (+18 pts) — the actual schools serving this property are materially stronger than the Newberry 01 average implies; a family-tenant draw the district grade alone would hide.
- Watch-outs: built in 1956 — expect roof / HVAC / electrical / plumbing capex.
- Market conditions: 97 active listings in the ZIP; 2 comparable units currently listed for rent nearby; 155 units permitted in Newberry County in 2024 (0 in 5+ unit buildings).
- Newberry County population projected to shrink 6% by 2050 — rents likely to lag national; underwrite the cash flow, not the appreciation.
- Current owner paid $33k; list at $90k implies a 176% gain — meaningful room to come down on a strong offer.
- At projected returns (-3.0% appreciation + 3.0% rent growth), your $25k cash investment doubles in ~8 years — after that, you're playing with house money.
- Climate carrying-cost: major wind risk, 27% chance of damaging wind over 30y; extreme-heat days projected 7→16/yr by 2055 (HVAC capex compounding) — expect insurance premiums to compound above CPI over the hold.
Questions for listing agent
- Built in 1956 — when were the roof, HVAC, electrical panel, plumbing, and water heater last replaced?
- Is there a deadline driving the sale (1031 exchange, divorce, estate, relocation)? That informs how much negotiation room exists.
- Schools are F-rated, which usually means shorter tenancies and higher turnover. Who's the typical renter profile here, and what's been the actual vacancy rate?
- Crime grade is F in this area — have there been break-ins, vandalism, or insurance claims at this property in the last 3 years? What carrier currently insures it and at what premium?
- What's the average days-on-market for RENTAL listings here right now (not sales)? A rising rental-DOM trend means longer vacancies and softer asking-rent achievability than the comps imply.
- What's the recent tenant-quality profile in this submarket — average credit score on applications, eviction rate, late-payment / NSF rate, and stable-employment percentage? A property-management company in the area should have these aggregated.
- How much new for-sale + rental construction is in the pipeline within 1–3 miles? Heavy new supply typically softens prices + rents 12–24 months out; constrained supply supports both.
CashFlowRE · CFR-FKEDT35K6AFK6Q
· Data 2 days ago
cashflowre.app · 2026-05-29