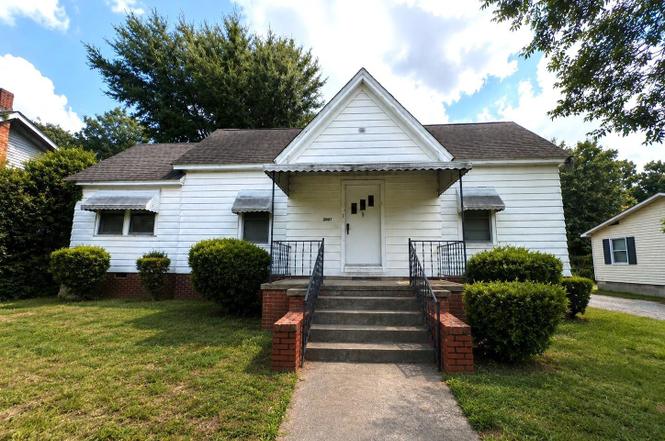
2007 Nance St · Newberry, SC
Flood risk 1/10 · Minimal
- FEMA flood zone
- X (unshaded)
- Chance of flooding over 30 yrs
- 0.0%
- Est. flood insurance / yr
- $507 – $1,088
Fire risk 3/10 · Minor
- Est. fire insurance / yr
- $783 – $1,453
Heat risk 6/10 · Moderate
- Hot days now (above 108°F)
- 7 days/yr
- Hot days in 30 yrs
- 16 days/yr
Wind risk 6/10 · Moderate
- Chance of severe wind over 30 yrs
- 27.0%
Air-quality risk 3/10 · Minor
- Unhealthy air days now
- 2 days/yr
- Unhealthy air days in 30 yrs
- 2 days/yr
Risk factors via First Street. Map © Google.
Why this score? — see what drove the C+ grade
The composite is a weighted blend of 9 inputs, each scored 0–100. Each bar is that input's sub-score; the figure is the points it added to the 100-point composite (weight × sub-score).
- Cash flow +29.9/30.0
- DSCR +10.0/10.0
- 1% rule +8.5/10.0
- ARV discount +5.0/15.0
- Livability +3.4/5.0
- Schools +3.0/10.0
- Rent growth +2.5/5.0
- Condition / age +2.5/5.0
- Appreciation +0.0/10.0
$89,900
🖨 Deal sheet 📄 Offer letter ✓ Due diligence
Listing remarks
Seller calling for HIGHEST & BEST due 6/18 by 5pm EST! Investor Special! Former income-producing rental property offering excellent value-add potential. Currently a 2BR/1BA home, with the possibility of an easy conversion to a 3-bedroom layout or potential reconfiguration into two 1-bedroom units (buyer to verify all feasibility, zoning, and permitting requirements). Year built is estimated based on information provided by the Newberry County Tax Assessor's Office. Sold strictly AS-IS, WHERE-IS. Great opportunity for investors, landlords, or renovators looking to maximize returns. Disclaimer: CMLS has not reviewed and, therefore, does not endorse vendors who may appear in listings.
Key facts
- 6,969 sq ft lot
- Built 1956
- Listed 3 days
Property features AI
Exterior
- Utilities: Public water; Public sewer
- Home design: One-story property
- Construction: Crawlspace foundation
- Exterior features: Other exterior finish; Paved road access
Interior
- Bedrooms: Master bedroom on the main level
- Bathrooms: One full bathroom
- Heating & cooling: Central heating; Other heating details (see remarks); Central cooling; Window units; Multiple cooling units
- Interior features: Three fireplaces
Neighborhood map
What this means for you Summary
Snapshot
- This is a 2-bed/1.0-bath single-family listed at $90k.
Deal economics
- At list price, monthly cash flow is $332 ($4k/yr) — positive.
- The deal already cash-flows at list — no discount required.
- Meets the 1% rule at list price ($1k rent vs $90k).
Location & tenants
- Location reads 67/100 on livability (#91 in SC) — a middle-class / working-renter tenant base. Strengths: cost of living A+, housing A+, health & safety A+; Watch: crime F, amenities F, commute F.
- Newberry 01 (rural): math 32% / reading 40% proficiency, ranked #40 of 80 in SC (top 50%) — families likely to look elsewhere, expect single-tenant / working-renter base with shorter leases; 60% free/reduced lunch — lower-income household profile, screen leases tightly.
- Zoned schools: Newberry High (math 42% / reading 67%, grade C-, #130 of 196 statewide, top 69%, 802 students, 91% FRL) — zoned schools average 91% FRL vs 60% district-wide (31 pts higher); higher-poverty schools than district average — tighter screening recommended.
- Zoned-school proficiency averages 54% at this address vs 36% district-wide (+18 pts) — the actual schools serving this property are materially stronger than the Newberry 01 average implies; a family-tenant draw the district grade alone would hide.
- Market conditions: 97 active listings in the ZIP; 2 comparable units currently listed for rent nearby; 155 units permitted in Newberry County in 2024 (0 in 5+ unit buildings).
Forward outlook
- Local home prices are declining (-3.0%/yr); year-one equity from $622 of loan paydown is wiped out by about $3k of value loss. Plan a longer hold.
- Newberry County population projected to shrink 6% by 2050 — rents likely to lag national; underwrite the cash flow, not the appreciation.
- At projected returns (-3.0% appreciation + 3.0% rent growth), your $25k cash investment doubles in ~8 years — after that, you're playing with house money.
Negotiation context
- Only 3 days on market — expect competitive offers; lowballing is unlikely to land.
- Current owner paid $33k; list at $90k implies a 176% gain — meaningful room to come down on a strong offer.
Risks & watch-outs
- Watch-outs: built in 1956 — expect roof / HVAC / electrical / plumbing capex.
- Climate carrying-cost: major wind risk, 27% chance of damaging wind over 30y; extreme-heat days projected 7→16/yr by 2055 (HVAC capex compounding) — expect insurance premiums to compound above CPI over the hold.
Questions for the listing agent
- Built in 1956 — when were the roof, HVAC, electrical panel, plumbing, and water heater last replaced?
- Is there a deadline driving the sale (1031 exchange, divorce, estate, relocation)? That informs how much negotiation room exists.
- Schools are F-rated, which usually means shorter tenancies and higher turnover. Who's the typical renter profile here, and what's been the actual vacancy rate?
- Crime grade is F in this area — have there been break-ins, vandalism, or insurance claims at this property in the last 3 years? What carrier currently insures it and at what premium?
- What's the average days-on-market for RENTAL listings here right now (not sales)? A rising rental-DOM trend means longer vacancies and softer asking-rent achievability than the comps imply.
- What's the recent tenant-quality profile in this submarket — average credit score on applications, eviction rate, late-payment / NSF rate, and stable-employment percentage? A property-management company in the area should have these aggregated.
- How much new for-sale + rental construction is in the pipeline within 1–3 miles? Heavy new supply typically softens prices + rents 12–24 months out; constrained supply supports both.
Investment metrics
- 1% rule
- 1.35% ✓
- Cap rate
- 10.73%
- Cash-on-cash
- 15.84%
- DSCR
- 1.70
- GRM
- 6.2
CMA / ARV
- ARV (on-the-fly)
- $85,080
- Comps found
- 1
Show comp detail 1 sale within ~0.75 mi
| Address | Dist | Beds/Ba | Sqft | Sold | Price | $/sf | Match |
|---|---|---|---|---|---|---|---|
| 610 Clara St | 0.72mi | 3/2.0 (+1) | 1,630 (+15%) | 1mo | $97,000 | $60 | 32 |
Match score weights: distance 35% · size 25% · config 20% · recency 20%. Top-matched comps best support the ARV.
Projected returns pro-forma
-3.0% appreciation · 3.0% rent growth · sell at horizon
- IRR
- 6.7%
- Equity multiple
- 1.26×
- Total profit
- $6,617
- Equity at exit
- $13,404
- IRR
- 16.1%
- Equity multiple
- 2.31×
- Total profit
- $33,094
- Equity at exit
- $7,773
Cash invested: $25,172 (down + closing). Projections, not guarantees.
Landlord ↔ Tenant lean methodology
- Overall (STATE)
- 90 Strongly Landlord-Friendly
- State South Carolina
- 90 Strongly Landlord-Friendly · R+6
- County
- — inherits STATE
- City
- — inherits STATE
ZIP-level market 29108
- Active inventory
- 97
- Price-to-rent
- 6.2×
Monthly cashflow live
- Estimated rent
- $1,210 medium interval (Pro) →
- Mortgage (P&I)
- −$471
- Tax from tax record
- −$115 /mo · $1,374/yr
- Insurance
- −$37
- HOA
- −$0
- Vacancy / Maint / Mgmt
- −$254
- Net cashflow
- $332
Break-even live
UW: 25.0% down · 7.5% · 30yr · 1.5% tax · 5.0% vac · 8.0% maint · 8.0% mgmt
Financing live
Cash to close
- Down payment
- $22,475
- Closing costs
- $2,697
- Reserves months
- —
- Total cash needed
- —
Loan-product check · same deal, 3 products live
Conventional
25% down · 7.5% · 30yr
- Down + closing
- —
- Monthly P&I
- —
- Monthly cashflow
- —
- DSCR
- —
- Eligible?
- —
Personal DTI + credit; lowest rate.
DSCR
20% down · 8.5% · 30yr
- Down + closing
- —
- Monthly P&I
- —
- Monthly cashflow
- —
- DSCR
- —
- Eligible?
- —
No personal income docs; deal must DSCR.
Hard money
10% down · 12.0% · 12mo
- Down + closing
- —
- Monthly P&I
- —
- Monthly cashflow
- —
- DSCR
- —
- Eligible?
- —
Short-term bridge; refi at stabilization.
Rent comps 2 comps
| Address | Beds | Baths | Sqft | Rent | $/sqft | DOM | Units | Dist |
|---|---|---|---|---|---|---|---|---|
| 1902 Vincent St Newberry, SC | 3.0 | 1.0 | 884 | $1,075 | $1.22 | 21d | 1 | 0.42mi |
| 1821 Charles St Newberry, SC | 3.0 | 1.5 | 1100 | $1,500 | $1.36 | 14d | 1 | 0.79mi |
Listing history 5 events
-
2026-06-18days on market $89,900 Active 3 DOM
-
2026-06-17remarks 693-char remark
-
2026-06-17days on market $89,900 Active 2 DOM
-
2026-06-15remarks 636-char remark
-
2026-06-15$89,900 Active 1 DOM
ⓘ Source: listings_history table (triggers on properties + properties_extension) + one-shot
backfill from property_details.listing_events for pre-trigger history.
Tax reassessment forecast SC · Resets to sale price
- Current annual tax
- $1,374 · $115/mo
- Projected year-2 tax
- $1,374 · $115/mo
- Expected delta
- $0/yr ($0/mo · 0.0%)
ⓘ Screening estimate from a state-policy table — verify with the county assessor before closing.
Climate risk First Street
- Flood 1/10 Low FEMA zone X (unshaded) · 0% chance over 30 yrs
- Wildfire 3/10 Moderate
- Heat 6/10 Major 7 d/yr ≥108°F today · 16 d/yr by 30 yrs out
- Wind 6/10 Major 27% chance of damaging wind over 30 yrs
- Air quality 3/10 Moderate 2 unhealthy d/yr today · 2 by 30 yrs out
Nearby sold comps map
Loading sold comps map…
Walkable amenities ~0.75 mi
Loading nearby amenities…
Taxation est. · year 1
- Rental income
- $14,518
- − Mortgage interest
- −$5,036
- − Property taxes
- −$1,374
- − Insurance
- −$450
- − Repairs & maintenance
- −$1,161
- − Management
- −$1,161
- − Depreciation
- −$2,615
- Taxable income
- $2,720
- Est. tax owed @ 24.0%
- −$653
- After-tax cash flow
- $3,335/yr
For passive investors: Depreciation is non-cash, so a rental often shows a tax loss while cash-flowing — sheltering income. Rental losses are passive: they offset passive income freely, and up to $25,000/yr can offset ordinary (W-2) income if you actively participate and your MAGI is under $100k (phasing out to $0 by $150k); unused losses carry forward. On sale, claimed depreciation is recaptured at up to 25%, and gains may owe capital-gains tax (a 1031 exchange can defer both). Figures are a year-1 estimate at your 24.0% rate — not tax advice; consult a CPA.
Schools (NCES district)
- District
- Newberry 01
- NCES district ID
- 4503030
- Math proficiency
- 32% ▼ -12.00%
- Reading proficiency
- 40% ▼ -1.00%
- Median HH income
- $40,892
- Composite
- 30.28/100
- National rank
- #6282
- State rank
- #40 of 80 in SC
Livability — Newberry
- Score
- 67/100
- State rank
- #91
- US rank
- #10365
Category grades
Schools grade is shown separately in the Schools card above.
Census & demographics
- Census place
- Newberry, SC
- County
- Newberry County · 19,585 people
- City population
- 19,585
- Metro
- Newberry, SC
- Population (ZIP)
- 19,585
- Household income
- $53,558
- Rent vs Own
- Severe rent burden
- 595.0
Population outlook (Newberry County) Hauer SSP2
- Today (2025)
- 38,350 people
- By 2030
- 38,259 · -0.2%
- By 2040
- 37,487 · -2.3%
- By 2050
- 36,219 · -5.6%
- By 2075
- 32,400 · -15.5%
- By 2100
- 27,201 · -29.1%
Race, ethnicity, and origin ACS 2023
- Neighborhood character
- Diverse neighborhood (Simpson 0.63)
- Race & ethnicity
- White 45% Black 39% Hispanic / Latino 15% Two or more races 7%
- Hispanic origin (detail)
- Mexican 9% Puerto Rican 2%
- Common ancestry
- Lithuanian 3% Slovak 2% Serbian 2%
- Foreign-born
- 9% · Canada, China
- Languages at home
- 84% English-only · Spanish 11% Other Indo-European 3% Arabic 1%
Political lean MEDSL · Newberry
- 2024 margin
- Solid R (+34.3) · D 32.2% · R 66.6% · Other 1.2%
- 2008→2024 swing
- -16.8pp toward R · 2008: -17.6pp · 2024: -34.3pp
- All cycles
- 2024: R+34.3 2020: R+24.1 2016: R+22.6 2012: R+14.3 2008: R+17.6
Not yet ingested
- Civics
- —
Market trends
- HPI YoY
- ▼ -119.09%
- Current HPI
- 132.8873
- Rent YoY
- —
- Metro
- Newberry, SC
- State GDP YoY
- ▲ 4.51%
- F500 in state
- 2
Industry mix (Fortune 500 HQ in SC)
| Industry | F500 HQs | Revenue |
|---|---|---|
| Packaging | 1 | $7B |
|
||
Price history
+175.8% since first listed2 events — show timeline
- 2026-06-15 Listed $89,900 Consolidated MLS
- 1995-09-29 Sold (Public Records) $32,600 Public Records
Property tax history
+0.3%/yrLatest (2025): $1,374 · +11.4% YoY. Source: county tax records.
Cash-flow waterfall
monthlySold comps — $/sqft
last 12 mo · ≤1 miLoading sold comps…