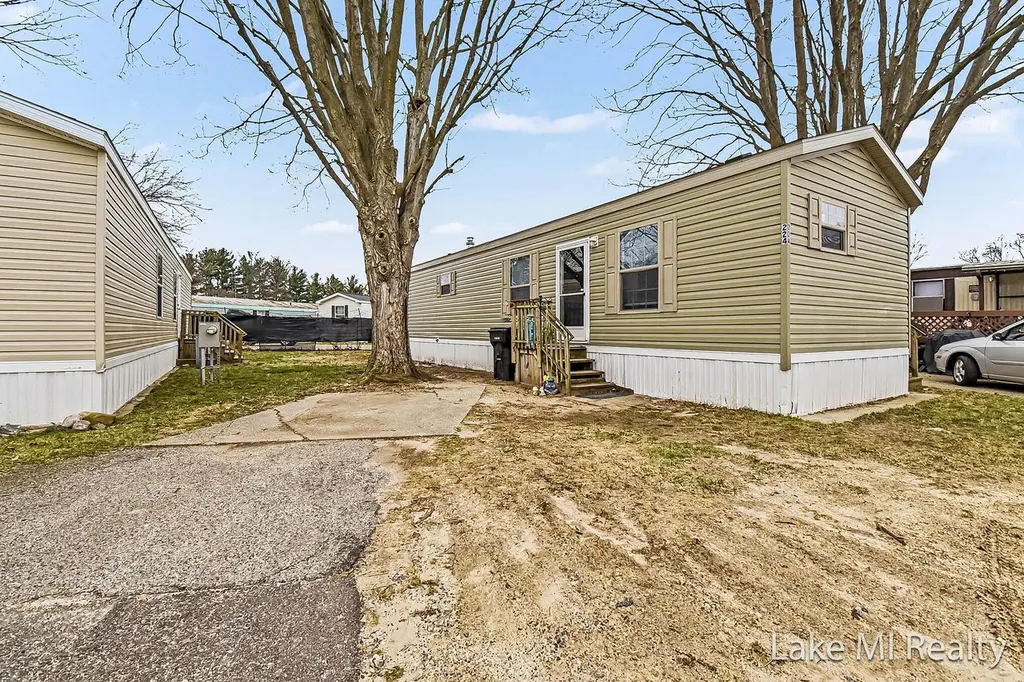
224 S Kenbrook St SE
Cutlerville, MI 49548
$45,000F
2 bd · 1.0 ba ·
705 sqft ·
Built 2017
· Manufactured
· Pending
· 54 DOM
Cashflow @ list (25.0% down · 7.5%)
Estimated rent
$1,055/mo
Mortgage (P&I)
−$236
Tax + insurance
−$75
HOA
−$633
Vac / Maint / Mgmt
−$222
Net cashflow
$-110/mo
Annual
$-1,322/yr
Cap rate
3.35%
Cash-on-cash
-10.49%
DSCR
0.53
1% rule
2.35%
Cash to close
$12,600
Investor read
- This is a 2-bed/1.0-bath manufactured listed at $45k. Condition is rated average.
- At list price, monthly cash flow is $-110 ($-1k/yr) — negative.
- To cash-flow at today's rent, offer at most $29k (35.4% below list).
- Meets the 1% rule at list price ($1k rent vs $45k).
- It's been on market 54 days — a 3% lower offer ($44k) is reasonable based on typical stale-listing flexibility.
- Recommended offer: $29k (35.4% below list) — sets the bar for cash-flow.
- Local home prices are declining (-3.0%/yr); year-one equity from $311 of loan paydown is wiped out by about $1k of value loss. Plan a longer hold.
- Location reads 71/100 on livability (#280 in MI) — a middle-class / working-renter tenant base. Strengths: cost of living A+, housing A+, health & safety A-; Watch: crime C-, amenities F, commute F.
- Kentwood Public Schools (suburban): math 34% / reading 46% proficiency, ranked #206 of 540 in MI (top 38%) — families likely to look elsewhere, expect single-tenant / working-renter base with shorter leases.
- Watch-outs: HOA is 60% of rent.
- Market conditions: 112 active listings in the ZIP; 3 comparable units currently listed for rent nearby; rentals leasing fast (median 5d on market — plan ~1-2 weeks tenant-placement turnaround); 2,253 units permitted in Kent County in 2024 (969 in 5+ unit buildings).
- Kent County population projected at +22% by 2050 — long-run rental-demand tailwind backs the buy-and-hold thesis.
- 3 sale attempts with the ask held roughly flat each time — persistent listings suggest the price (not the market) is what's stuck; bring a comps-based counter.
- Cap rate 3.4% vs local median 2.5% in Cutlerville — top-decile yield for the area; either an underpriced asset or a hidden risk that comps aren't pricing in. Stress-test before assuming the spread holds.
Questions for listing agent
- What do current leases actually rent for vs. the listed asking? Can we see a recent rent roll and the last 12 months of T-12 income?
- It's been on market 54 days. Have you received any prior offers? Is the seller open to a 35% concession, seller financing, or rate buy-down credit?
- What does the HOA fee cover, when was the last increase, and are there any pending special assessments or reserve-fund shortfalls?
- Is there a deadline driving the sale (1031 exchange, divorce, estate, relocation)? That informs how much negotiation room exists.
- The area grade is low — what's the realistic commute time and amenity access for the typical tenant pool here? Any planned neighborhood developments (good or bad) we should know about?
- What's the average days-on-market for RENTAL listings here right now (not sales)? A rising rental-DOM trend means longer vacancies and softer asking-rent achievability than the comps imply.
- What's the recent tenant-quality profile in this submarket — average credit score on applications, eviction rate, late-payment / NSF rate, and stable-employment percentage? A property-management company in the area should have these aggregated.
- How much new for-sale + rental construction is in the pipeline within 1–3 miles? Heavy new supply typically softens prices + rents 12–24 months out; constrained supply supports both.
Repairs flagged (vision-AI assessment)
- Minor: exterior siding — visible wear
- Minor: interior paint — some wear
CashFlowRE · CFR-FMAKKB4QNBX7GN
· Data 3 weeks ago
cashflowre.app · 2026-05-29