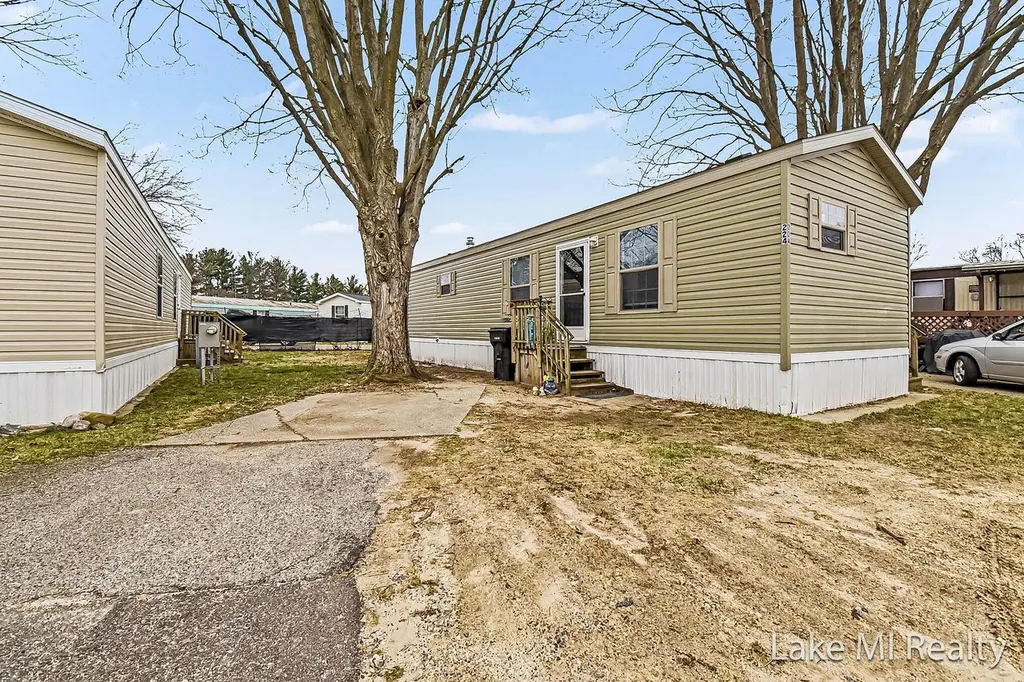
224 S Kenbrook St SE · Cutlerville, MI
Flood risk No data
- FEMA flood zone
- —
- Chance of flooding over 30 yrs
- —
- Est. flood insurance / yr
- —
Fire risk No data
- Est. fire insurance / yr
- —
Heat risk No data
- Hot days now (above threshold)
- —
- Hot days in 30 yrs
- —
Wind risk No data
- Chance of severe wind over 30 yrs
- —
Air-quality risk No data
- Unhealthy air days now
- —
- Unhealthy air days in 30 yrs
- —
Risk factors via First Street. Map © Google.
Why this score? — see what drove the F grade
The composite is a weighted blend of 9 inputs, each scored 0–100. Each bar is that input's sub-score; the figure is the points it added to the 100-point composite (weight × sub-score).
- 1% rule +10.0/10.0
- ARV discount +7.5/15.0
- Cash flow +4.8/30.0
- Livability +3.6/5.0
- Schools +3.4/10.0
- Condition / age +2.8/5.0
- Rent growth +2.5/5.0
- DSCR +0.0/10.0
- Appreciation +0.0/10.0
$45,000
🖨 Deal sheet (PDF) 📄 Offer letter ✓ Due diligence
Listing remarks MLS
Affordable mobile home located in a convenient Grand Rapids location! This cozy property features 2 bedrooms and 1 full bathroom across 706 square feet of living space, offering a functional and comfortable layout. Perfect for first-time buyers or those looking to downsize, this home provides a great opportunity to add your personal touch. Enjoy low-maintenance living with easy access to nearby amenities, shopping, dining, and major highways. Don't miss this opportunity--schedule your showing today!
Key facts
- Built 2017
- Listed 54 days
Neighborhood map
What this means for you Summary
Snapshot
- This is a 2-bed/1.0-bath manufactured listed at $45k. Condition is rated average.
Deal economics
- At list price, monthly cash flow is $-110 ($-1k/yr) — negative.
- To cash-flow at today's rent, offer at most $29k (35.4% below list).
- Meets the 1% rule at list price ($1k rent vs $45k).
- Recommended offer: $29k (35.4% below list) — sets the bar for cash-flow.
- Cap rate 3.4% vs local median 2.5% in Cutlerville — top-decile yield for the area; either an underpriced asset or a hidden risk that comps aren't pricing in. Stress-test before assuming the spread holds.
Location & tenants
- Location reads 71/100 on livability (#280 in MI) — a middle-class / working-renter tenant base. Strengths: cost of living A+, housing A+, health & safety A-; Watch: crime C-, amenities F, commute F.
- Kentwood Public Schools (suburban): math 34% / reading 46% proficiency, ranked #206 of 540 in MI (top 38%) — families likely to look elsewhere, expect single-tenant / working-renter base with shorter leases.
- Market conditions: 112 active listings in the ZIP; 3 comparable units currently listed for rent nearby; rentals leasing fast (median 5d on market — plan ~1-2 weeks tenant-placement turnaround); 2,253 units permitted in Kent County in 2024 (969 in 5+ unit buildings).
Forward outlook
- Local home prices are declining (-3.0%/yr); year-one equity from $311 of loan paydown is wiped out by about $1k of value loss. Plan a longer hold.
- Kent County population projected at +22% by 2050 — long-run rental-demand tailwind backs the buy-and-hold thesis.
Negotiation context
- It's been on market 54 days — a 3% lower offer ($44k) is reasonable based on typical stale-listing flexibility.
- 3 sale attempts with the ask held roughly flat each time — persistent listings suggest the price (not the market) is what's stuck; bring a comps-based counter.
Risks & watch-outs
- Watch-outs: HOA is 60% of rent.
Questions for the listing agent
- What do current leases actually rent for vs. the listed asking? Can we see a recent rent roll and the last 12 months of T-12 income?
- It's been on market 54 days. Have you received any prior offers? Is the seller open to a 35% concession, seller financing, or rate buy-down credit?
- What does the HOA fee cover, when was the last increase, and are there any pending special assessments or reserve-fund shortfalls?
- Is there a deadline driving the sale (1031 exchange, divorce, estate, relocation)? That informs how much negotiation room exists.
- The area grade is low — what's the realistic commute time and amenity access for the typical tenant pool here? Any planned neighborhood developments (good or bad) we should know about?
- What's the average days-on-market for RENTAL listings here right now (not sales)? A rising rental-DOM trend means longer vacancies and softer asking-rent achievability than the comps imply.
- What's the recent tenant-quality profile in this submarket — average credit score on applications, eviction rate, late-payment / NSF rate, and stable-employment percentage? A property-management company in the area should have these aggregated.
- How much new for-sale + rental construction is in the pipeline within 1–3 miles? Heavy new supply typically softens prices + rents 12–24 months out; constrained supply supports both.
Investment metrics
- 1% rule
- 2.35% ✓
- Cap rate
- 3.35%
- Cash-on-cash
- -10.49%
- DSCR
- 0.53
- GRM
- 3.6
CMA / ARV
- ARV (median comp)
- $45,000
- List price
- $45,000
- Delta
- —
- Verdict
- FAIR
- Comps
- 1 within 2.0 mi
Show comp detail 1 sale within ~0.75 mi
| Address | Dist | Beds/Ba | Sqft | Sold | Price | $/sf | Match |
|---|---|---|---|---|---|---|---|
| 224 S Kenbrook St SE | 0.00mi | 2/1.0 | 705 (0%) | 1mo | $45,000 | $64 | 99 |
Match score weights: distance 35% · size 25% · config 20% · recency 20%. Top-matched comps best support the ARV.
Projected returns pro-forma
-3.0% appreciation · 3.0% rent growth · sell at horizon
- IRR
- -33.6%
- Equity multiple
- -0.10×
- Total profit
- $-13,904
- Equity at exit
- $6,710
- IRR
- -34.1%
- Equity multiple
- -0.55×
- Total profit
- $-19,499
- Equity at exit
- $3,891
Cash invested: $12,600 (down + closing). Projections, not guarantees.
Landlord ↔ Tenant lean methodology
- Overall (STATE)
- 62 Landlord-Friendly
- State Michigan
- 62 Landlord-Friendly · EVEN
- County
- — inherits STATE
- City
- — inherits STATE
ZIP-level market 49548
- Active inventory
- 112
- Price-to-rent
- 3.6×
Monthly cashflow live
- Estimated rent
- $1,055 medium interval (Pro) →
- Mortgage (P&I)
- −$236
- Tax est. 1.5%
- −$56 /mo · $675/yr
- Insurance
- −$19
- HOA
- −$633
- Lot rent leased land?
- −$0
- Vacancy / Maint / Mgmt
- −$222
- Net cashflow
- $-110
Break-even live
Sensitivity live
| Price | -10% $-79 | -5% $-95 | +0% $-110 | +5% $-126 | +10% $-141 |
|---|---|---|---|---|---|
| Rent | -10% $-194 | -5% $-152 | +0% $-110 | +5% $-68 | +10% $-27 |
| Rate | -1.0pp $-88 | -0.5pp $-99 | base $-110 | +0.5pp $-122 | +1.0pp $-134 |
UW: 25.0% down · 7.5% · 30yr · 1.5% tax · 5.0% vac · 8.0% maint · 8.0% mgmt
Financing live
Cash to close
- Down payment
- $11,250
- Closing costs
- $1,350
- Reserves months
- —
- Total cash needed
- —
Loan-product check · same deal, 3 products live
Conventional
25% down · 7.5% · 30yr
- Down + closing
- —
- Monthly P&I
- —
- Monthly cashflow
- —
- DSCR
- —
- Eligible?
- —
Personal DTI + credit; lowest rate.
DSCR
20% down · 8.5% · 30yr
- Down + closing
- —
- Monthly P&I
- —
- Monthly cashflow
- —
- DSCR
- —
- Eligible?
- —
No personal income docs; deal must DSCR.
Hard money
10% down · 12.0% · 12mo
- Down + closing
- —
- Monthly P&I
- —
- Monthly cashflow
- —
- DSCR
- —
- Eligible?
- —
Short-term bridge; refi at stabilization.
Rent comps 3 comps
| Address | Beds | Baths | Sqft | Rent | $/sqft | DOM | Units | Dist |
|---|---|---|---|---|---|---|---|---|
| 6471 Division Ave S Grand Rapids, MI | 2.0 | 1.0 | 728 | $1,399 | $1.92 | 13d | 1 | 0.45mi |
| 5310 Kellogg Woods Dr SE Grand Rapids, MI | 1.0 | 1.0 | 625 | $1,329 | $2.13 | 5d | 10 | 1.08mi |
| 5128 St Louis Dr SE Grand Rapids, MI | 1.0 | 1.0 | 701 | $1,030 | $1.47 | 5d | 1 | 1.30mi |
HOA detail
- Monthly dues
- $633 · $7,596/yr
Listing history 3 events
-
2026-03-27$45,000 Active 504-char remark
Show marketing remark (504 chars)
Affordable mobile home located in a convenient Grand Rapids location! This cozy property features 2 bedrooms and 1 full bathroom across 706 square feet of living space, offering a functional and comfortable layout. Perfect for first-time buyers or those looking to downsize, this home provides a great opportunity to add your personal touch. Enjoy low-maintenance living with easy access to nearby amenities, shopping, dining, and major highways. Don't miss this opportunity--schedule your showing today!
-
2026-03-27$45,000 Active
Show marketing remark (504 chars)
Affordable mobile home located in a convenient Grand Rapids location! This cozy property features 2 bedrooms and 1 full bathroom across 706 square feet of living space, offering a functional and comfortable layout. Perfect for first-time buyers or those looking to downsize, this home provides a great opportunity to add your personal touch. Enjoy low-maintenance living with easy access to nearby amenities, shopping, dining, and major highways. Don't miss this opportunity--schedule your showing today!
ⓘ Source: listings_history table (triggers on properties + properties_extension) + one-shot
backfill from property_details.listing_events for pre-trigger history.
Nearby sold comps map
Loading sold comps map…
Walkable amenities ~0.75 mi
Loading nearby amenities…
Taxation est. · year 1
- Rental income
- $12,665
- − Mortgage interest
- −$2,521
- − Property taxes
- −$675
- − Insurance
- −$225
- − Repairs & maintenance
- −$1,013
- − Management
- −$1,013
- − HOA
- −$7,596
- − Depreciation
- −$1,309
- Taxable loss
- −$1,687
- Est. tax savings @ 24.0%
- +$405
- After-tax cash flow
- $-917/yr
For passive investors: Depreciation is non-cash, so a rental often shows a tax loss while cash-flowing — sheltering income. Rental losses are passive: they offset passive income freely, and up to $25,000/yr can offset ordinary (W-2) income if you actively participate and your MAGI is under $100k (phasing out to $0 by $150k); unused losses carry forward. On sale, claimed depreciation is recaptured at up to 25%, and gains may owe capital-gains tax (a 1031 exchange can defer both). Figures are a year-1 estimate at your 24.0% rate — not tax advice; consult a CPA.
Condition & rehab AI · 12 photos
This mobile home is in average condition with some cosmetic repairs needed. It offers a functional layout and is located in a convenient Grand Rapids location.
Repairs flagged
- Minor exterior siding — visible wear
- Minor interior paint — some wear
Value-add opportunities
- Both paint interior walls — enhances curb appeal and interior aesthetics
- Both repair exterior siding — improves curb appeal and structural integrity
- Both landscaping — enhances curb appeal and adds value
Renovation cost estimate screening
| Repair item | Severity | Est. cost |
|---|---|---|
| exterior siding · visible wear | Minor | $500–3,000 |
| interior paint · some wear | Minor | $500–3,000 |
| Total estimated repair cost · 2 items | $1,000–6,000 |
Value-add ROI direction
- Both paint interior walls — enhances curb appeal and interior aesthetics ↑
- Both repair exterior siding — improves curb appeal and structural integrity ↑
- Both landscaping — enhances curb appeal and adds value ↑
ⓘ Cost ranges are severity-bucket heuristics (US national rule-of-thumb). Get contractor quotes + a written scope before underwriting a rehab budget.
Schools (NCES district)
- District
- Kentwood Public Schools
- NCES district ID
- 2620340
- Math proficiency
- 34% ▼ -4.00%
- Reading proficiency
- 46% ▼ -3.00%
- Median HH income
- $48,962
- Composite
- 34.35/100
- National rank
- #5226
- State rank
- #206 of 540 in MI
Livability — Cutlerville
- Score
- 71/100
- State rank
- #280
- US rank
- #6874
Category grades
Schools grade is shown separately in the Schools card above.
Census & demographics
- Census place
- Cutlerville, MI
- County
- Kent County · 533,805 people
- Metro
- Grand Rapids-Kentwood, MI
- Population (ZIP)
- 34,777
- Household income
- $61,636
- Rent vs Own
- Severe rent burden
- 781.0
Population outlook (Kent County) Hauer SSP2
- Today (2025)
- 712,484 people
- By 2030
- 748,618 · +5.1%
- By 2040
- 814,777 · +14.4%
- By 2050
- 868,556 · +21.9%
- By 2075
- 966,487 · +35.7%
- By 2100
- 967,975 · +35.9%
Race, ethnicity, and origin ACS 2023
- Neighborhood character
- Diverse neighborhood (Simpson 0.68)
- Race & ethnicity
- White 49% Hispanic / Latino 22% Two or more races 16% Black 15% Asian 6% Native American 1%
- Hispanic origin (detail)
- Mexican 15% Puerto Rican 4%
- Common ancestry
- Iranian 10% Romanian 4% Lithuanian 2%
- Foreign-born
- 13% · Canada, Vietnam, China
- Languages at home
- 78% English-only · Spanish 14% Vietnamese 2% French/Haitian/Cajun 1%
Political lean MEDSL · Kent
- 2024 margin
- Lean D (+5.4) · D 51.8% · R 46.5% · Other 1.7%
- 2008→2024 swing
- +4.8pp toward D · 2008: 0.5pp · 2024: 5.4pp
- All cycles
- 2024: D+5.4 2020: D+6.1 2016: R+3.1 2012: R+7.9 2008: D+0.5
Not yet ingested
- Civics
- —
Market trends
- HPI YoY
- ▼ -208.41%
- Current HPI
- 325.8096
- Rent YoY
- —
- Metro
- Grand Rapids-Kentwood, MI
- State GDP YoY
- ▲ 1.37%
- F500 in state
- 28
Industry mix (Fortune 500 HQ in MI)
| Industry | F500 HQs | Revenue |
|---|---|---|
| Automotive Parts | 3 | $48B |
|
||
| Automotive | 2 | $372B |
|
||
| Chemicals | 1 | $45B |
|
||
| Automotive Retail | 1 | $29B |
|
||
| Healthcare / Medical Devices | 1 | $23B |
|
||
| Automotive Technology | 1 | $20B |
|
||
Price history
+0.0% since first listed3 events — show timeline
- 2026-03-27 Listed $45,000 MiRealSource-MiMLS
- 2026-03-27 Listed $45,000 REALCOMP
- 2026-03-27 Listed $45,000 SW Michigan MLS
Cash-flow waterfall
monthlySold comps — $/sqft
last 12 mo · ≤1 miLoading sold comps…