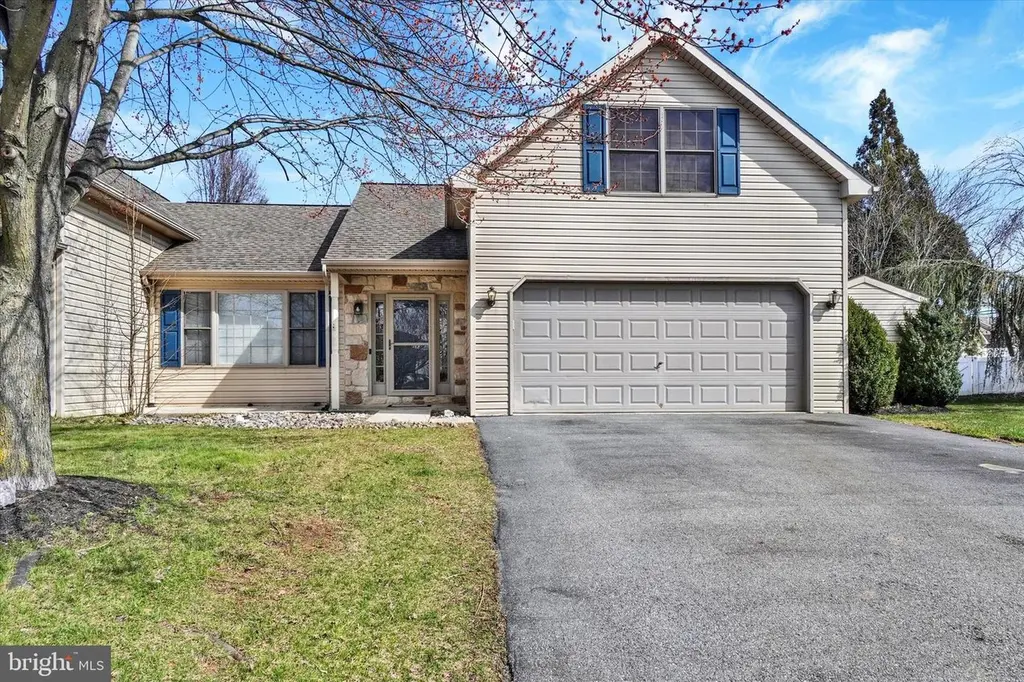
2202 Weeping Willow Ln
Mount Joy, PA 17552
$389,900C
3 bd · 2.5 ba ·
2,081 sqft ·
Built 2003
· MultiFamily
· Pending
· 3 DOM
Cashflow @ list (25.0% down · 7.5%)
Estimated rent
$4,086/mo
Mortgage (P&I)
−$2,045
Tax + insurance
−$542
HOA
−$0
Vac / Maint / Mgmt
−$858
Net cashflow
$642/mo
Annual
$7,699/yr
Cap rate
8.27%
Cash-on-cash
7.05%
DSCR
1.31
1% rule
1.05%
Cash to close
$109,172
Investor read
- This is a 3-bed/2.5-bath multifamily listed at $390k.
- At list price, monthly cash flow is $642 ($8k/yr) — positive.
- The deal already cash-flows at list — no discount required.
- Meets the 1% rule at list price ($4k rent vs $390k).
- Only 3 days on market — expect competitive offers; lowballing is unlikely to land.
- Local home prices are declining (-3.0%/yr); year-one equity from $3k of loan paydown is wiped out by about $12k of value loss. Plan a longer hold.
- Location reads 86/100 on livability (#59 in PA, #410 nationally) — a professional / high-income tenant draw. Strengths: crime A+, cost of living A+, housing A+; Watch: commute D.
- Manheim Central SD (suburban): math 38% / reading 53% proficiency, ranked #242 of 539 in PA (top 45%) — families likely to look elsewhere, expect single-tenant / working-renter base with shorter leases.
- Market conditions: 101 active listings in the ZIP; solid renter incomes; 1,093 units permitted in Lancaster County in 2024 (201 in 5+ unit buildings).
- Lancaster County population projected at +5% by 2050 — modest demand growth; plan on rents tracking national, not racing it.
- 3 sale attempts since 23y ago with the ask held roughly flat each time — persistent listings suggest the price (not the market) is what's stuck; bring a comps-based counter.
- Current owner paid $215k; list at $390k implies a 81% gain — meaningful room to come down on a strong offer.
- Climate carrying-cost: extreme-heat days projected 7→16/yr by 2055 (HVAC capex compounding) — expect insurance premiums to compound above CPI over the hold.
- Cap rate 8.3% vs local median 2.6% in Mount Joy — top-decile yield for the area; either an underpriced asset or a hidden risk that comps aren't pricing in. Stress-test before assuming the spread holds.
- At $4,086/mo this rent would consume 50% of the median local household income ($98k/yr) (locally 429% of renters already pay >50% of income on rent) — very limited rent-growth headroom before tenants either downsize or default.
Questions for listing agent
- Is there a deadline driving the sale (1031 exchange, divorce, estate, relocation)? That informs how much negotiation room exists.
- Schools are B-rated — typically a magnet for longer-tenancy family renters. What's the average tenant stay here, and is there a school-zone premium baked into asking?
- What's the average days-on-market for RENTAL listings here right now (not sales)? A rising rental-DOM trend means longer vacancies and softer asking-rent achievability than the comps imply.
- What's the recent tenant-quality profile in this submarket — average credit score on applications, eviction rate, late-payment / NSF rate, and stable-employment percentage? A property-management company in the area should have these aggregated.
- How much new apartment / multifamily construction is in the pipeline within 1–3 miles? Heavy new supply (>2% of stock underway) typically softens rents 12–24 months out; light construction supports rent growth.
CashFlowRE · CFR-FMTW41F1CF2R94
· Data 3 weeks ago
cashflowre.app · 2026-05-29