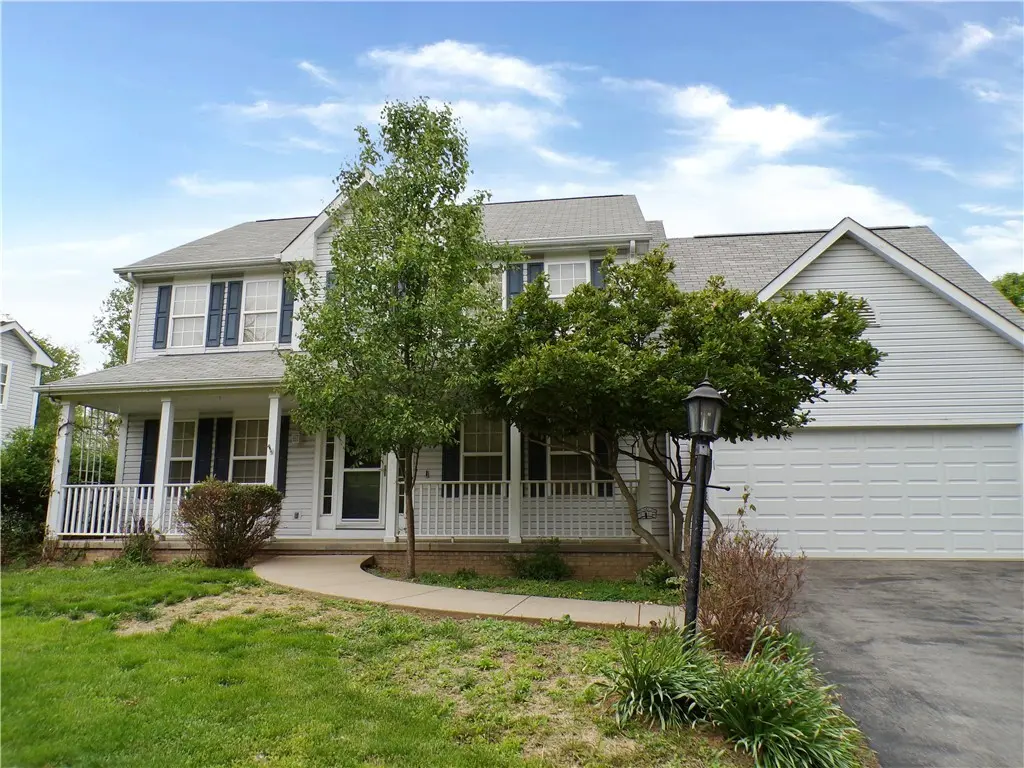
6767 Mars Crider Rd
Seven Fields, PA 16046
$456,900D
3 bd · 2.5 ba ·
2,251 sqft ·
Built 1998
· SingleFamily
· Active
· 42 DOM
Cashflow @ list (25.0% down · 7.5%)
Estimated rent
$3,121/mo
Mortgage (P&I)
−$2,396
Tax + insurance
−$646
HOA
−$0
Vac / Maint / Mgmt
−$656
Net cashflow
$-576/mo
Annual
$-6,912/yr
Cap rate
4.78%
Cash-on-cash
-5.40%
DSCR
0.76
1% rule
0.68%
Cash to close
$127,932
Investor read
- This is a 3-bed/2.5-bath single-family listed at $457k.
- At list price, monthly cash flow is $-576 ($-7k/yr) — negative.
- To cash-flow at today's rent, offer at most $355k (22.3% below list).
- To meet the 1% rule (rent ≥ 1% of price), the offer needs to be $312k (31.7% below list).
- It's been on market 42 days — a 3% lower offer ($443k) is reasonable based on typical stale-listing flexibility.
- Recommended offer: $312k (31.7% below list) — sets the bar for 1% rule.
- Local home prices are declining (-3.0%/yr); year-one equity from $3k of loan paydown is wiped out by about $14k of value loss. Plan a longer hold.
- Location reads 79/100 on livability (#266 in PA, #2,336 nationally) — a middle-class / working-renter tenant base. Strengths: crime A+, employment A+, housing A+; Watch: amenities D+, health & safety D, commute F.
- Seneca Valley SD (rural): math 48% / reading 67% proficiency, ranked #73 of 539 in PA (top 14%) — acceptable for families but not a draw, mixed tenant base, ~2y average lease; only 12% free/reduced lunch — higher-income household profile.
- Market conditions: 109 active listings in the ZIP; 13 comparable units currently listed for rent nearby; rentals at typical pace (median 16d on market — plan ~3-4 weeks tenant-placement turnaround); 987 units permitted in Butler County in 2024 (0 in 5+ unit buildings).
- Butler County population projected to shrink 5% by 2050 — rents likely to lag national; underwrite the cash flow, not the appreciation.
- 4 sale attempts since 7y ago; this cycle's ask has dropped $25k (5%) from the opening price — seller is motivated, your offer sets the floor, not the list.
- Current owner paid $368k; 24% above their basis — modest negotiation headroom, anchor on the comps not their cost.
Questions for listing agent
- What do current leases actually rent for vs. the listed asking? Can we see a recent rent roll and the last 12 months of T-12 income?
- It's been on market 42 days. Have you received any prior offers? Is the seller open to a 32% concession, seller financing, or rate buy-down credit?
- Is there a deadline driving the sale (1031 exchange, divorce, estate, relocation)? That informs how much negotiation room exists.
- Schools are B-rated — typically a magnet for longer-tenancy family renters. What's the average tenant stay here, and is there a school-zone premium baked into asking?
- The area grade is low — what's the realistic commute time and amenity access for the typical tenant pool here? Any planned neighborhood developments (good or bad) we should know about?
- What's the average days-on-market for RENTAL listings here right now (not sales)? A rising rental-DOM trend means longer vacancies and softer asking-rent achievability than the comps imply.
- What's the recent tenant-quality profile in this submarket — average credit score on applications, eviction rate, late-payment / NSF rate, and stable-employment percentage? A property-management company in the area should have these aggregated.
- How much new for-sale + rental construction is in the pipeline within 1–3 miles? Heavy new supply typically softens prices + rents 12–24 months out; constrained supply supports both.
CashFlowRE · CFR-FN0Q41EWKXE5RW
· Data 2 days ago
cashflowre.app · 2026-05-29