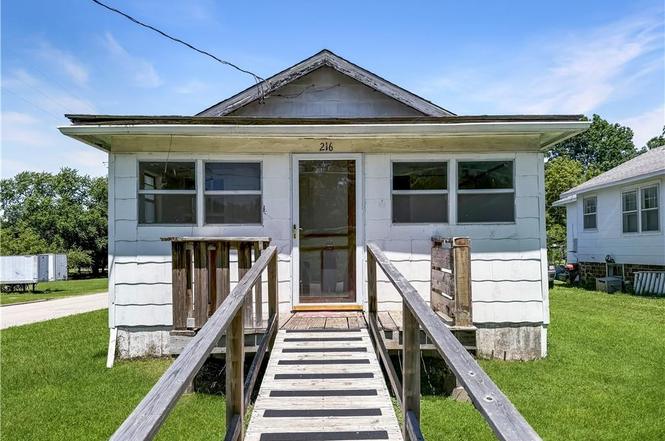
216 W 22nd St
Higginsville, MO 64037
$60,000B-
2 bd · 1.0 ba ·
600 sqft ·
Built 1930
· SingleFamily
· Active
· 4 DOM
Cashflow @ list (25.0% down · 7.5%)
Estimated rent
$995/mo
Mortgage (P&I)
−$315
Tax + insurance
−$70
HOA
−$0
Vac / Maint / Mgmt
−$209
Net cashflow
$402/mo
Annual
$4,819/yr
Cap rate
14.32%
Cash-on-cash
28.68%
DSCR
2.28
1% rule
1.66%
Cash to close
$16,800
Investor read
- This is a 2-bed/1.0-bath single-family listed at $60k.
- At list price, monthly cash flow is $402 ($5k/yr) — positive.
- The deal already cash-flows at list — no discount required.
- Meets the 1% rule at list price ($995 rent vs $60k).
- Only 4 days on market — expect competitive offers; lowballing is unlikely to land.
- Local home prices are declining (-3.0%/yr); year-one equity from $415 of loan paydown is wiped out by about $2k of value loss. Plan a longer hold.
- Location reads 70/100 on livability (#135 in MO) — a middle-class / working-renter tenant base. Strengths: cost of living A+, housing A+, health & safety B+; Watch: employment D, amenities F, commute F.
- Lafayette County C-1 (town): math 26% / reading 43% proficiency, ranked #221 of 324 in MO (top 68%) — families likely to look elsewhere, expect single-tenant / working-renter base with shorter leases.
- Zoned schools: Lafayette Co. High (math 42% / reading 52%, grade D-, #155 of 521 statewide, top 32%, 310 students, 41% FRL) — zoned schools at 41% FRL track the district average.
- Zoned-school proficiency averages 47% at this address vs 34% district-wide (+12 pts) — the actual schools serving this property are materially stronger than the Lafayette County C-1 average implies; a family-tenant draw the district grade alone would hide.
- Watch-outs: built in 1930 — expect roof / HVAC / electrical / plumbing capex.
- Market conditions: 31 active listings in the ZIP; 1 comparable units currently listed for rent nearby; 112 units permitted in Lafayette County in 2024 (0 in 5+ unit buildings).
- Lafayette County population projected at -21% by 2050 — secular population decline; favor cash flow + early exit over multi-decade hold.
- At projected returns (-3.0% appreciation + 3.0% rent growth), your $17k cash investment doubles in ~5 years — after that, you're playing with house money.
- Cap rate 14.3% vs local median 4.0% in Higginsville — top-decile yield for the area; either an underpriced asset or a hidden risk that comps aren't pricing in. Stress-test before assuming the spread holds.
Questions for listing agent
- Built in 1930 — when were the roof, HVAC, electrical panel, plumbing, and water heater last replaced?
- Is there a deadline driving the sale (1031 exchange, divorce, estate, relocation)? That informs how much negotiation room exists.
- What's the average days-on-market for RENTAL listings here right now (not sales)? A rising rental-DOM trend means longer vacancies and softer asking-rent achievability than the comps imply.
- What's the recent tenant-quality profile in this submarket — average credit score on applications, eviction rate, late-payment / NSF rate, and stable-employment percentage? A property-management company in the area should have these aggregated.
- How much new for-sale + rental construction is in the pipeline within 1–3 miles? Heavy new supply typically softens prices + rents 12–24 months out; constrained supply supports both.
CashFlowRE · CFR-FPFP7V3R6H7S7F
· Data 23 h ago
cashflowre.app · 2026-05-29