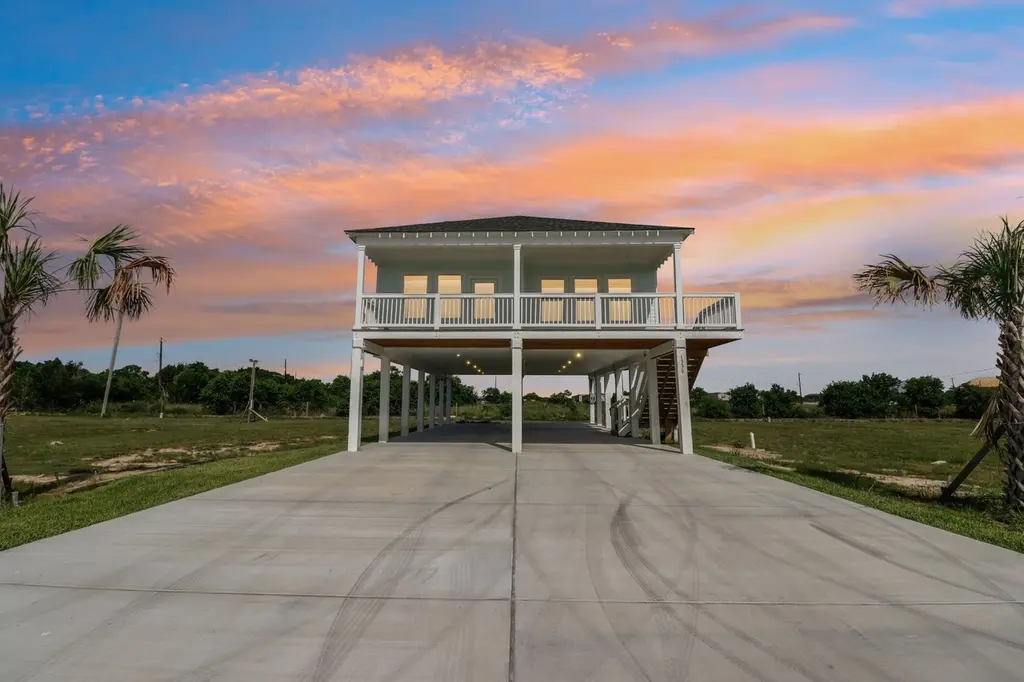
1330 Sapphire Palms Ct
San Leon, TX 77539
$337,000D+
4 bd · 2.0 ba ·
1,613 sqft ·
Built 2024
· SingleFamily
· Active
· 167 DOM
Cashflow @ list (25.0% down · 7.5%)
Estimated rent
$3,164/mo
Mortgage (P&I)
−$1,767
Tax + insurance
−$1,180
HOA
−$0
Vac / Maint / Mgmt
−$664
Net cashflow
$-448/mo
Annual
$-5,377/yr
Cap rate
6.22%
Cash-on-cash
-0.27%
DSCR
0.99
1% rule
0.94%
Cash to close
$94,360
Investor read
- This is a 4-bed/2.0-bath single-family listed at $337k. Condition is rated good.
- At list price, monthly cash flow is $-448 ($-5k/yr) — negative.
- To cash-flow at today's rent, offer at most $258k (23.5% below list).
- To meet the 1% rule (rent ≥ 1% of price), the offer needs to be $316k (6.1% below list).
- It's been on market 167 days — a 12% lower offer ($297k) is reasonable based on typical stale-listing flexibility.
- Recommended offer: $258k (23.5% below list) — sets the bar for cash-flow.
- Local home prices are declining (-3.0%/yr); year-one equity from $2k of loan paydown is wiped out by about $10k of value loss. Plan a longer hold.
- Location reads 62/100 on livability (#899 in TX) — a middle-class / working-renter tenant base. Strengths: cost of living A+, housing A+, employment B+; Watch: schools F, amenities F, commute F.
- Dickinson ISD (suburban): math 39% / reading 40% proficiency, ranked #366 of 826 in TX (top 44%) — families likely to look elsewhere, expect single-tenant / working-renter base with shorter leases; 60% free/reduced lunch — lower-income household profile, screen leases tightly.
- Watch-outs: flood insurance adds $427/mo.
- Market conditions: Rents soft (-0.1%/yr); 664 active listings in the ZIP; 2 comparable units currently listed for rent nearby; solid renter incomes; 3,258 units permitted in Galveston County in 2024 (0 in 5+ unit buildings).
- Galveston County population projected at +43% by 2050 — long-run rental-demand tailwind backs the buy-and-hold thesis.
- 5 sale attempts since 3y ago with the ask held roughly flat each time — persistent listings suggest the price (not the market) is what's stuck; bring a comps-based counter.
- Climate carrying-cost: in FEMA flood zone AE (mandatory federal flood insurance); severe wind risk, 99% chance of damaging wind over 30y; extreme-heat days projected 7→27/yr by 2055 (HVAC capex compounding) — expect insurance premiums to compound above CPI over the hold.
- Cap rate 6.2% vs local median 1.8% in San Leon — top-decile yield for the area; either an underpriced asset or a hidden risk that comps aren't pricing in. Stress-test before assuming the spread holds.
- This rent runs 43% of the median local income ($89k/yr) — at the standard rent-burdened threshold; future hikes will face affordability resistance.
Questions for listing agent
- What do current leases actually rent for vs. the listed asking? Can we see a recent rent roll and the last 12 months of T-12 income?
- It's been on market 167 days. Have you received any prior offers? Is the seller open to a 23% concession, seller financing, or rate buy-down credit?
- What's the actual annual flood-insurance premium (NFIP or private), and is the property in a SFHA with mandatory coverage?
- Why hasn't it sold? Are there any deal-killer items the seller is aware of (foundation, flood, title, zoning, code violations)?
- Is there a deadline driving the sale (1031 exchange, divorce, estate, relocation)? That informs how much negotiation room exists.
- Schools are F-rated, which usually means shorter tenancies and higher turnover. Who's the typical renter profile here, and what's been the actual vacancy rate?
- The area grade is low — what's the realistic commute time and amenity access for the typical tenant pool here? Any planned neighborhood developments (good or bad) we should know about?
- What's the average days-on-market for RENTAL listings here right now (not sales)? A rising rental-DOM trend means longer vacancies and softer asking-rent achievability than the comps imply.
CashFlowRE · CFR-FQRK0XCTFE7A2F
· Data 2 days ago
cashflowre.app · 2026-05-29