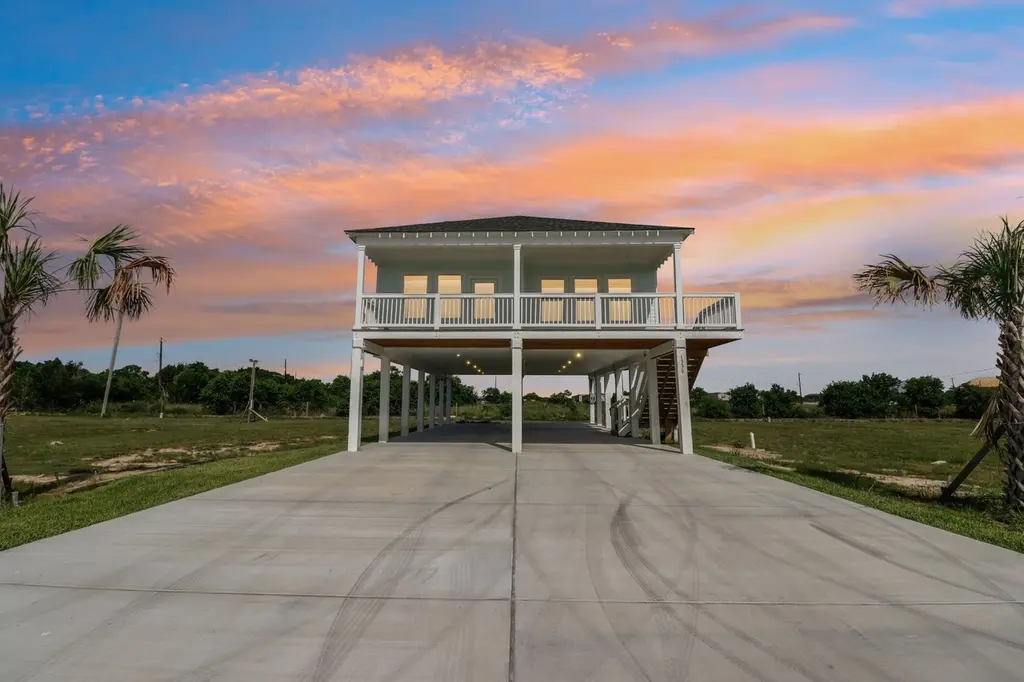
1330 Sapphire Palms Ct · San Leon, TX
Flood risk 10/10 · Severe
- FEMA flood zone
- AE
- Chance of flooding over 30 yrs
- 0.99%
- Est. flood insurance / yr
- $1,737 – $8,500
Fire risk 1/10 · Minimal
- Est. fire insurance / yr
- $1,222 – $2,270
Heat risk 10/10 · Severe
- Hot days now (above 109°F)
- 7 days/yr
- Hot days in 30 yrs
- 27 days/yr
Wind risk 10/10 · Severe
- Chance of severe wind over 30 yrs
- 99.0%
Air-quality risk 2/10 · Minimal
- Unhealthy air days now
- 1 days/yr
- Unhealthy air days in 30 yrs
- 1 days/yr
Risk factors via First Street. Map © Google.
Why this score? — see what drove the D+ grade
The composite is a weighted blend of 9 inputs, each scored 0–100. Each bar is that input's sub-score; the figure is the points it added to the 100-point composite (weight × sub-score).
- ARV discount +13.9/15.0
- Cash flow +13.0/30.0
- 1% rule +4.4/10.0
- Condition / age +4.0/5.0
- DSCR +3.9/10.0
- Schools +3.5/10.0
- Livability +3.1/5.0
- Rent growth +2.5/5.0
- Appreciation +0.0/10.0
$337,000
🖨 Deal sheet 📄 Offer letter ✓ Due diligence
Listing remarks MLS
Welcome to Sapphire Palms, a gated new-construction community offering an elevated yet approachable coastal lifestyle in San Leon. This intimate 22-home neighborhood features thoughtfully designed homes with covered front porches, modern finishes, and flexible living spaces ideal for everyday living or a weekend escape. Inside, enjoy vinyl plank flooring throughout the main living areas, tiled bathrooms, and quartz countertops in the kitchen and baths. Select floor plans offer the option for a rear porch off the primary bedroom, extending your living space outdoors and inviting in coastal breezes. With no HOA and short-term rental friendly flexibility, Sapphire Palms is an excellent opportunity for first-time buyers seeking quality new construction at an attainable price point, as well as second-home buyers looking for a low-maintenance coastal retreat near the bay.
Key facts
- Gated community
- Quartz countertops
- New construction
Tags
Neighborhood map
What this means for you Summary
Snapshot
- This is a 4-bed/2.0-bath single-family listed at $337k. Condition is rated good.
Deal economics
- At list price, monthly cash flow is $-448 ($-5k/yr) — negative.
- To cash-flow at today's rent, offer at most $258k (23.5% below list).
- To meet the 1% rule (rent ≥ 1% of price), the offer needs to be $316k (6.1% below list).
- Recommended offer: $258k (23.5% below list) — sets the bar for cash-flow.
- Cap rate 6.2% vs local median 1.8% in San Leon — top-decile yield for the area; either an underpriced asset or a hidden risk that comps aren't pricing in. Stress-test before assuming the spread holds.
Location & tenants
- Location reads 62/100 on livability (#899 in TX) — a middle-class / working-renter tenant base. Strengths: cost of living A+, housing A+, employment B+; Watch: schools F, amenities F, commute F.
- Dickinson ISD (suburban): math 39% / reading 40% proficiency, ranked #366 of 826 in TX (top 44%) — families likely to look elsewhere, expect single-tenant / working-renter base with shorter leases; 60% free/reduced lunch — lower-income household profile, screen leases tightly.
- Market conditions: Rents soft (-0.1%/yr); 664 active listings in the ZIP; 2 comparable units currently listed for rent nearby; solid renter incomes; 3,258 units permitted in Galveston County in 2024 (0 in 5+ unit buildings).
- This rent runs 43% of the median local income ($89k/yr) — at the standard rent-burdened threshold; future hikes will face affordability resistance.
Forward outlook
- Local home prices are declining (-3.0%/yr); year-one equity from $2k of loan paydown is wiped out by about $10k of value loss. Plan a longer hold.
- Galveston County population projected at +43% by 2050 — long-run rental-demand tailwind backs the buy-and-hold thesis.
Negotiation context
- It's been on market 167 days — a 12% lower offer ($297k) is reasonable based on typical stale-listing flexibility.
- 5 sale attempts since 3y ago with the ask held roughly flat each time — persistent listings suggest the price (not the market) is what's stuck; bring a comps-based counter.
Risks & watch-outs
- Watch-outs: flood insurance adds $427/mo.
- Climate carrying-cost: in FEMA flood zone AE (mandatory federal flood insurance); severe wind risk, 99% chance of damaging wind over 30y; extreme-heat days projected 7→27/yr by 2055 (HVAC capex compounding) — expect insurance premiums to compound above CPI over the hold.
Questions for the listing agent
- What do current leases actually rent for vs. the listed asking? Can we see a recent rent roll and the last 12 months of T-12 income?
- It's been on market 167 days. Have you received any prior offers? Is the seller open to a 23% concession, seller financing, or rate buy-down credit?
- What's the actual annual flood-insurance premium (NFIP or private), and is the property in a SFHA with mandatory coverage?
- Why hasn't it sold? Are there any deal-killer items the seller is aware of (foundation, flood, title, zoning, code violations)?
- Is there a deadline driving the sale (1031 exchange, divorce, estate, relocation)? That informs how much negotiation room exists.
- Schools are F-rated, which usually means shorter tenancies and higher turnover. Who's the typical renter profile here, and what's been the actual vacancy rate?
- The area grade is low — what's the realistic commute time and amenity access for the typical tenant pool here? Any planned neighborhood developments (good or bad) we should know about?
- What's the average days-on-market for RENTAL listings here right now (not sales)? A rising rental-DOM trend means longer vacancies and softer asking-rent achievability than the comps imply.
- What's the recent tenant-quality profile in this submarket — average credit score on applications, eviction rate, late-payment / NSF rate, and stable-employment percentage? A property-management company in the area should have these aggregated.
- How much new for-sale + rental construction is in the pipeline within 1–3 miles? Heavy new supply typically softens prices + rents 12–24 months out; constrained supply supports both.
Investment metrics
- 1% rule
- 0.94% ✗
- Cap rate
- 6.22%
- Cash-on-cash
- -0.27%
- DSCR
- 0.99
- GRM
- 8.9
CMA / ARV
- ARV (median comp)
- $392,900
- List price
- $337,000
- Delta
- -14.23%
- Verdict
- UNDERPRICED
- Comps
- 20 within 1.0 mi
Show comp detail 10 sales within ~0.75 mi
| Address | Dist | Beds/Ba | Sqft | Sold | Price | $/sf | Match |
|---|---|---|---|---|---|---|---|
| 1311 Sapphire Palms Ct | 0.06mi | 4/2.0 | 1,567 (-3%) | 11mo | $330,000 | $211 | 83 |
| 2364 Bryan St | 0.09mi | 3/2.0 (-1) | 1,500 (-7%) | 12mo | $449,500 | $300 | 69 |
| 1306 23rd St | 0.21mi | 3/2.5 (-1) | 1,622 (+1%) | 17mo | $399,900 | $247 | 68 |
| 1319 Sapphire Palms Ct | 0.05mi | 3/2.0 (-1) | 1,375 (-15%) | 8mo | $293,550 | $213 | 61 |
| 2424 Avenue N | 0.26mi | 4/2.0 | 1,764 (+9%) | 15mo | $449,000 | $255 | 60 |
| 1331 Sapphire Palms Ct | 0.04mi | 3/2.0 (-1) | 1,375 (-15%) | 13mo | $330,000 | $240 | 57 |
| 1218 Island Dr | 0.28mi | 3/3.0 (-1) | 1,434 (-11%) | 5mo | $439,900 | $307 | 55 |
| 1343 Sapphire Palms Ct | 0.04mi | 3/2.0 (-1) | 1,375 (-15%) | 17mo | $285,000 | $207 | 55 |
| 1631 25th St | 0.51mi | 3/2.0 (-1) | 1,504 (-7%) | 18mo | $350,500 | $233 | 46 |
| 1647 25th St | 0.54mi | 3/2.0 (-1) | 1,408 (-13%) | 14mo | $350,000 | $249 | 37 |
Match score weights: distance 35% · size 25% · config 20% · recency 20%. Top-matched comps best support the ARV.
Projected returns pro-forma
-3.0% appreciation · 0.0% rent growth · sell at horizon
- IRR
- -30.4%
- Equity multiple
- 0.03×
- Total profit
- $-91,990
- Equity at exit
- $50,248
- IRR
- -60.7%
- Equity multiple
- -0.60×
- Total profit
- $-150,946
- Equity at exit
- $29,138
Cash invested: $94,360 (down + closing). Projections, not guarantees.
Landlord ↔ Tenant lean methodology
- Overall (STATE)
- 87 Strongly Landlord-Friendly
- State Texas
- 87 Strongly Landlord-Friendly · R+5
- County
- — inherits STATE
- City
- — inherits STATE
ZIP-level market 77539
- Home prices YoY
- -29.8%
- Rents YoY
- -0.1%
- Active inventory
- 664
- Price-to-rent
- 8.9×
Monthly cashflow live
- Estimated rent
- $3,164 medium interval (Pro) →
- Mortgage (P&I)
- −$1,767
- Tax from tax record
- −$613 /mo · $7,362/yr
- Insurance
- −$140
- Flood insurance flood zone
- −$427 /mo · $5,118/yr
- HOA
- −$0
- Vacancy / Maint / Mgmt
- −$664
- Net cashflow
- $-448
Break-even live
UW: 25.0% down · 7.5% · 30yr · 1.5% tax · 5.0% vac · 8.0% maint · 8.0% mgmt
Financing live
Cash to close
- Down payment
- $84,250
- Closing costs
- $10,110
- Reserves months
- —
- Total cash needed
- —
Loan-product check · same deal, 3 products live
Conventional
25% down · 7.5% · 30yr
- Down + closing
- —
- Monthly P&I
- —
- Monthly cashflow
- —
- DSCR
- —
- Eligible?
- —
Personal DTI + credit; lowest rate.
DSCR
20% down · 8.5% · 30yr
- Down + closing
- —
- Monthly P&I
- —
- Monthly cashflow
- —
- DSCR
- —
- Eligible?
- —
No personal income docs; deal must DSCR.
Hard money
10% down · 12.0% · 12mo
- Down + closing
- —
- Monthly P&I
- —
- Monthly cashflow
- —
- DSCR
- —
- Eligible?
- —
Short-term bridge; refi at stabilization.
Rent comps 2 comps
| Address | Beds | Baths | Sqft | Rent | $/sqft | DOM | Units | Dist |
|---|---|---|---|---|---|---|---|---|
| 2735 Broadway St Unit 1546437P San Leon, TX | 3.0 | 2.0 | 1819 | $4,994 | $2.75 | 12d | 1 | 1.37mi |
| 535 12th St Dickinson, TX | 3.0 | 2.0 | 1248 | $1,950 | $1.56 | 1d | 1 | 1.50mi |
Listing history 26 events
-
2026-06-18days on market $337,000 Active 167 DOM
-
2026-06-17days on market $337,000 Active 166 DOM
-
2026-06-16days on market $337,000 Active 165 DOM
-
2026-06-15days on market $337,000 Active 164 DOM
-
2026-06-13days on market $337,000 Active 162 DOM
-
2026-06-09days on market $337,000 Active 158 DOM
-
2026-06-08days on market $337,000 Active 157 DOM
-
2026-06-07days on market $337,000 Active 156 DOM
-
2026-06-04days on market $337,000 Active 153 DOM
-
2026-06-03days on market $337,000 Active 152 DOM
-
2026-06-02days on market $337,000 Active 151 DOM
-
2026-06-02days on market $337,000 Active 150 DOM
-
2026-05-31days on market $337,000 Active 149 DOM
-
2026-03-24price $337,000 880-char remark
Show marketing remark (880 chars)
Welcome to Sapphire Palms, a gated new-construction community offering an elevated yet approachable coastal lifestyle in San Leon. This intimate 22-home neighborhood features thoughtfully designed homes with covered front porches, modern finishes, and flexible living spaces ideal for everyday living or a weekend escape. Inside, enjoy vinyl plank flooring throughout the main living areas, tiled bathrooms, and quartz countertops in the kitchen and baths. Select floor plans offer the option for a rear porch off the primary bedroom, extending your living space outdoors and inviting in coastal breezes. With no HOA and short-term rental friendly flexibility, Sapphire Palms is an excellent opportunity for first-time buyers seeking quality new construction at an attainable price point, as well as second-home buyers looking for a low-maintenance coastal retreat near the bay.
-
2026-01-02$330,000 Active 880-char remark
Show marketing remark (880 chars)
Welcome to Sapphire Palms, a gated new-construction community offering an elevated yet approachable coastal lifestyle in San Leon. This intimate 22-home neighborhood features thoughtfully designed homes with covered front porches, modern finishes, and flexible living spaces ideal for everyday living or a weekend escape. Inside, enjoy vinyl plank flooring throughout the main living areas, tiled bathrooms, and quartz countertops in the kitchen and baths. Select floor plans offer the option for a rear porch off the primary bedroom, extending your living space outdoors and inviting in coastal breezes. With no HOA and short-term rental friendly flexibility, Sapphire Palms is an excellent opportunity for first-time buyers seeking quality new construction at an attainable price point, as well as second-home buyers looking for a low-maintenance coastal retreat near the bay.
-
2025-12-17historical
-
2025-02-12$330,000 Active
-
2025-02-12historical
-
2024-12-17$330,000 Active
-
2024-11-26historical
-
2024-02-15historical
-
2023-11-22status Active
-
2023-11-03historical
-
2023-10-05price $299,000
-
2023-10-04$295,000 Active
-
2023-08-22soldstatus
ⓘ Source: listings_history table (triggers on properties + properties_extension) + one-shot
backfill from property_details.listing_events for pre-trigger history.
Tax reassessment forecast TX · Resets to sale price
- Current annual tax
- $7,362 · $613/mo
- Projected year-2 tax
- $7,362 · $613/mo
- Expected delta
- $0/yr ($0/mo · 0.0%)
ⓘ Screening estimate from a state-policy table — verify with the county assessor before closing.
Climate risk First Street
- Flood 10/10 Extreme FEMA zone AE · 99% chance over 30 yrs
- Wildfire 1/10 Low
- Heat 10/10 Extreme 7 d/yr ≥109°F today · 27 d/yr by 30 yrs out
- Wind 10/10 Extreme 99% chance of damaging wind over 30 yrs
- Air quality 2/10 Low 1 unhealthy d/yr today · 1 by 30 yrs out
Nearby sold comps map
Loading sold comps map…
Walkable amenities ~0.75 mi
Loading nearby amenities…
Taxation est. · year 1
- Rental income
- $37,969
- − Mortgage interest
- −$18,877
- − Property taxes
- −$7,362
- − Insurance
- −$6,804
- − Repairs & maintenance
- −$3,038
- − Management
- −$3,038
- − Depreciation
- −$9,804
- Taxable loss
- −$10,952
- Est. tax savings @ 24.0%
- +$2,628
- After-tax cash flow
- $-2,748/yr
For passive investors: Depreciation is non-cash, so a rental often shows a tax loss while cash-flowing — sheltering income. Rental losses are passive: they offset passive income freely, and up to $25,000/yr can offset ordinary (W-2) income if you actively participate and your MAGI is under $100k (phasing out to $0 by $150k); unused losses carry forward. On sale, claimed depreciation is recaptured at up to 25%, and gains may owe capital-gains tax (a 1031 exchange can defer both). Figures are a year-1 estimate at your 24.0% rate — not tax advice; consult a CPA.
Condition & rehab AI · 6 photos
This single-family home in Sapphire Palms is in good condition with no major repairs needed. It offers a good return on investment with updates to the exterior and interior that would significantly enhance its value.
Value-add opportunities
- Both Paint exterior — Enhances curb appeal and value
- Both Paint interior walls — Improves interior appearance and value
- Both Install new flooring in kitchen and bathrooms — Enhances functionality and value
Renovation cost estimate screening
Value-add ROI direction
- Both Paint exterior — Enhances curb appeal and value ↑
- Both Paint interior walls — Improves interior appearance and value ↑
- Both Install new flooring in kitchen and bathrooms — Enhances functionality and value ↑
ⓘ Cost ranges are severity-bucket heuristics (US national rule-of-thumb). Get contractor quotes + a written scope before underwriting a rehab budget.
Schools (NCES district)
- District
- Dickinson ISD
- NCES district ID
- 4817070
- Math proficiency
- 39% ▼ -11.00%
- Reading proficiency
- 40% ▼ -2.00%
- Median HH income
- $61,318
- Composite
- 35.16/100
- National rank
- #5005
- State rank
- #366 of 826 in TX
Livability — San Leon
- Score
- 62/100
- State rank
- #899
- US rank
- #16159
Category grades
Schools grade is shown separately in the Schools card above.
Census & demographics
- Census place
- San Leon, TX
- County
- Galveston County · 357,330 people
- Metro
- Houston-The Woodlands-Sugar Land, TX
- Population (ZIP)
- 49,375
- Household income
- $89,111
- Rent vs Own
- Severe rent burden
- 869.0
Population outlook (Galveston County) Hauer SSP2
- Today (2025)
- 390,640 people
- By 2030
- 425,226 · +8.9%
- By 2040
- 493,765 · +26.4%
- By 2050
- 559,698 · +43.3%
- By 2075
- 719,260 · +84.1%
- By 2100
- 819,628 · +109.8%
Race, ethnicity, and origin ACS 2023
- Neighborhood character
- Diverse neighborhood (Simpson 0.64)
- Race & ethnicity
- White 47% Hispanic / Latino 37% Two or more races 19% Black 10% Asian 3%
- Hispanic origin (detail)
- Mexican 29% Puerto Rican 2%
- Common ancestry
- Italian 3% Romanian 2% Lithuanian 1%
- Foreign-born
- 13% · Canada, Vietnam
- Languages at home
- 73% English-only · Spanish 24% Vietnamese 1% Other Indo-European 1%
Political lean MEDSL · Galveston
- 2024 margin
- Strong R (+27.4) · D 35.7% · R 63.1% · Other 1.2%
- 2008→2024 swing
- -7.9pp toward R · 2008: -19.5pp · 2024: -27.4pp
- All cycles
- 2024: R+27.4 2020: R+22.6 2016: R+22.6 2012: R+26.9 2008: R+19.5
Not yet ingested
- Civics
- —
Market trends
- HPI YoY
- ▼ -109.46%
- Current HPI
- 258.0104
- Rent YoY
- ▼ -0.12%
- Metro
- Houston-The Woodlands-Sugar Land, TX
- State GDP YoY
- ▲ 3.95%
- F500 in state
- 110
Industry mix (Fortune 500 HQ in TX)
| Industry | F500 HQs | Revenue |
|---|---|---|
| Energy | 16 | $1,198B |
|
||
| Technology | 5 | $198B |
|
||
| Engineering / Construction | 4 | $72B |
|
||
| Energy Services | 3 | $60B |
|
||
| Utilities | 3 | $41B |
|
||
| Healthcare | 2 | $330B |
|
||
Price history
+14.2% since first listed13 events — show timeline
- 2026-03-24 Price Changed $337,000 HARMLS
- 2026-01-02 Listed $330,000 HARMLS
- 2025-12-17 Listing Removed — HARMLS
- 2025-02-12 Listing Removed — HARMLS
- 2025-02-12 Listed $330,000 HARMLS
- 2024-12-17 Listed $330,000 HARMLS
- 2024-11-26 Coming Soon — HARMLS
- 2024-02-15 Listing Removed — HARMLS
- 2023-11-22 Relisted — HARMLS
- 2023-11-03 Listing Removed — HARMLS
- 2023-10-05 Price Changed $299,000 HARMLS
- 2023-10-04 Listed $295,000 HARMLS
- 2023-08-22 Sold (Public Records) — Public Records
Property tax history
+188.0%/yrLatest (2025): $7,362 · +25.9% YoY. Source: county tax records.
Cash-flow waterfall
monthlySold comps — $/sqft
last 12 mo · ≤1 miLoading sold comps…