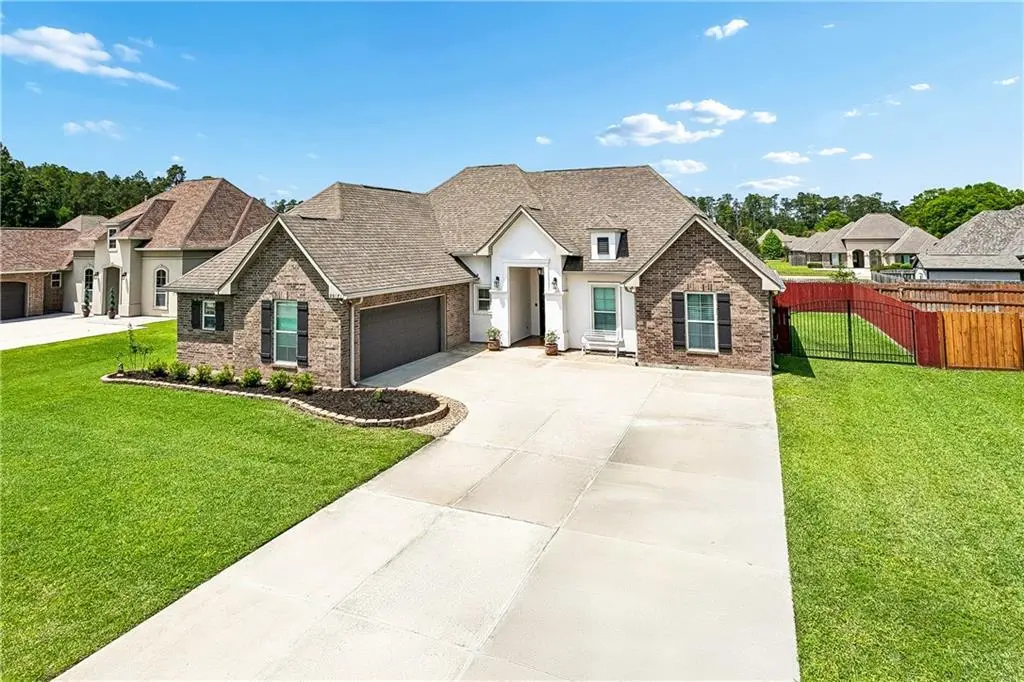
20171 Camden Ln
Hammond, LA 70403
$312,000D-
4 bd · 2.0 ba ·
1,915 sqft ·
Built 2013
· SingleFamily
· Pending
· 30 DOM
Cashflow @ list (25.0% down · 7.5%)
Estimated rent
$2,509/mo
Mortgage (P&I)
−$1,636
Tax + insurance
−$318
HOA
−$37
Vac / Maint / Mgmt
−$527
Net cashflow
$-9/mo
Annual
$-106/yr
Cap rate
6.26%
Cash-on-cash
-0.12%
DSCR
0.99
1% rule
0.80%
Cash to close
$87,360
Investor read
- This is a 4-bed/2.0-bath single-family listed at $312k.
- At list price, monthly cash flow is $-9 ($-106/yr) — negative.
- To cash-flow at today's rent, offer at most $310k (0.5% below list).
- To meet the 1% rule (rent ≥ 1% of price), the offer needs to be $251k (19.6% below list).
- It's been on market 30 days — a 2% lower offer ($307k) is reasonable based on typical stale-listing flexibility.
- Recommended offer: $251k (19.6% below list) — sets the bar for 1% rule.
- Local home prices are declining (-3.0%/yr); year-one equity from $2k of loan paydown is wiped out by about $9k of value loss. Plan a longer hold.
- Location reads 69/100 on livability (#77 in LA) — a middle-class / working-renter tenant base. Strengths: cost of living A+, health & safety A+; Watch: amenities C-, commute D+, schools D.
- Tangipahoa Parish (rural): math 18% / reading 29% proficiency, ranked #63 of 98 in LA (top 64%) — low school quality limits family demand, transient renter base, plan for 1-2y turnover; 73% free/reduced lunch — lower-income household profile, screen leases tightly.
- Market conditions: Rents flat; 329 active listings in the ZIP; 4 comparable units currently listed for rent nearby; rentals lingering (median 44d on market — plan ~5-8 weeks vacancy on turnover, expect pricing pressure); 75% of comp listings sitting > 30 days — soft ceiling on asking rent; 1,085 units permitted in Tangipahoa Parish in 2024 (378 in 5+ unit buildings).
- Tangipahoa County population projected at +22% by 2050 — long-run rental-demand tailwind backs the buy-and-hold thesis.
- 7 sale attempts since 13y ago with the ask held roughly flat each time — persistent listings suggest the price (not the market) is what's stuck; bring a comps-based counter.
- Current owner paid $229k; 36% above their basis — modest negotiation headroom, anchor on the comps not their cost.
- Cap rate 6.3% vs local median 5.0% in Hammond — meaningfully above typical; check what's discounted (condition, days-on-market, listing class) to confirm the premium yield is real.
- At $2,509/mo this rent would consume 59% of the median local household income ($51k/yr) (locally 1201% of renters already pay >50% of income on rent) — very limited rent-growth headroom before tenants either downsize or default.
Questions for listing agent
- What do current leases actually rent for vs. the listed asking? Can we see a recent rent roll and the last 12 months of T-12 income?
- What does the HOA fee cover, when was the last increase, and are there any pending special assessments or reserve-fund shortfalls?
- Is there a deadline driving the sale (1031 exchange, divorce, estate, relocation)? That informs how much negotiation room exists.
- Schools are D-rated, which usually means shorter tenancies and higher turnover. Who's the typical renter profile here, and what's been the actual vacancy rate?
- Crime grade is F in this area — have there been break-ins, vandalism, or insurance claims at this property in the last 3 years? What carrier currently insures it and at what premium?
- The area grade is low — what's the realistic commute time and amenity access for the typical tenant pool here? Any planned neighborhood developments (good or bad) we should know about?
- What's the average days-on-market for RENTAL listings here right now (not sales)? A rising rental-DOM trend means longer vacancies and softer asking-rent achievability than the comps imply.
- What's the recent tenant-quality profile in this submarket — average credit score on applications, eviction rate, late-payment / NSF rate, and stable-employment percentage? A property-management company in the area should have these aggregated.
CashFlowRE · CFR-FS39Z5C4MJ268J
· Data 3 weeks ago
cashflowre.app · 2026-05-29