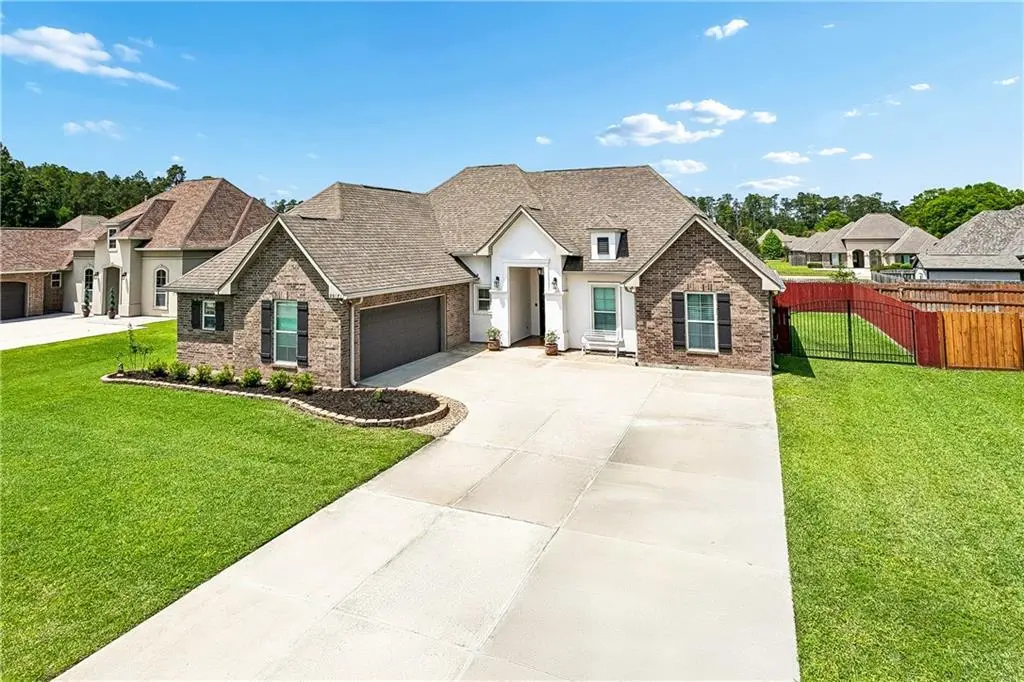
20171 Camden Ln · Hammond, LA
Flood risk No data
- FEMA flood zone
- —
- Chance of flooding over 30 yrs
- —
- Est. flood insurance / yr
- —
Fire risk No data
- Est. fire insurance / yr
- —
Heat risk No data
- Hot days now (above threshold)
- —
- Hot days in 30 yrs
- —
Wind risk No data
- Chance of severe wind over 30 yrs
- —
Air-quality risk No data
- Unhealthy air days now
- —
- Unhealthy air days in 30 yrs
- —
Risk factors via First Street. Map © Google.
Why this score? — see what drove the D- grade
The composite is a weighted blend of 9 inputs, each scored 0–100. Each bar is that input's sub-score; the figure is the points it added to the 100-point composite (weight × sub-score).
- Cash flow +13.1/30.0
- ARV discount +8.9/15.0
- DSCR +3.9/10.0
- Livability +3.5/5.0
- 1% rule +3.0/10.0
- Rent growth +2.6/5.0
- Condition / age +2.5/5.0
- Schools +2.0/10.0
- Appreciation +0.0/10.0
$312,000
🖨 Deal sheet 📄 Offer letter ✓ Due diligence
Listing remarks MLS
Outstanding 4BR/2BA home located in the desirable Woodlake Estates subdivision. Built in 2013, this home offers an inviting, spacious layout. Enjoy outdoor living with a covered patio and a fully fenced backyard, great for relaxing or entertaining. Additional features include a two-car garage, a security system, an outdoor shed, a community pool, and convenient access to nearby shopping, dining, and everyday essentials. Schedule your showing today!
Key facts
- Garage
- Community pool
- Built 2013
Property features AI
Finance
- HOA & community: Homeowners association with semi-annual fee of $220; Community pool
Exterior
- Parking: Garage with garage door opener
- Security: Security system; Closed-circuit cameras
- Utilities: Public water; Public sewer; Water-heater energy-efficient feature
- Home design: Single-story; Brick, stucco and vinyl siding exterior; Shingle roof; Slab foundation; Excellent condition; City lot, rectangular (90 x 120)
- Construction: Built with brick, stucco and vinyl siding
- Exterior features: Fence; Patio (concrete, covered); Shed(s); Community pool
Interior
- Kitchen: Dishwasher; Microwave; Oven; Range
- Bathrooms: 2 full bathrooms
- Heating & cooling: Central heating; Central air conditioning
- Interior features: Stainless steel appliances; Gas fireplace
Neighborhood map
What this means for you Summary
Snapshot
- This is a 4-bed/2.0-bath single-family listed at $312k.
Deal economics
- At list price, monthly cash flow is $-9 ($-106/yr) — negative.
- To cash-flow at today's rent, offer at most $310k (0.5% below list).
- To meet the 1% rule (rent ≥ 1% of price), the offer needs to be $251k (19.6% below list).
- Recommended offer: $251k (19.6% below list) — sets the bar for 1% rule.
- Cap rate 6.3% vs local median 5.0% in Hammond — meaningfully above typical; check what's discounted (condition, days-on-market, listing class) to confirm the premium yield is real.
Location & tenants
- Location reads 69/100 on livability (#77 in LA) — a middle-class / working-renter tenant base. Strengths: cost of living A+, health & safety A+; Watch: amenities C-, commute D+, schools D.
- Tangipahoa Parish (rural): math 18% / reading 29% proficiency, ranked #63 of 98 in LA (top 64%) — low school quality limits family demand, transient renter base, plan for 1-2y turnover; 73% free/reduced lunch — lower-income household profile, screen leases tightly.
- Market conditions: Rents flat; 329 active listings in the ZIP; 4 comparable units currently listed for rent nearby; rentals lingering (median 44d on market — plan ~5-8 weeks vacancy on turnover, expect pricing pressure); 75% of comp listings sitting > 30 days — soft ceiling on asking rent; 1,085 units permitted in Tangipahoa Parish in 2024 (378 in 5+ unit buildings).
- At $2,509/mo this rent would consume 59% of the median local household income ($51k/yr) (locally 1201% of renters already pay >50% of income on rent) — very limited rent-growth headroom before tenants either downsize or default.
Forward outlook
- Local home prices are declining (-3.0%/yr); year-one equity from $2k of loan paydown is wiped out by about $9k of value loss. Plan a longer hold.
- Tangipahoa County population projected at +22% by 2050 — long-run rental-demand tailwind backs the buy-and-hold thesis.
Negotiation context
- It's been on market 30 days — a 2% lower offer ($307k) is reasonable based on typical stale-listing flexibility.
- 7 sale attempts since 13y ago with the ask held roughly flat each time — persistent listings suggest the price (not the market) is what's stuck; bring a comps-based counter.
- Current owner paid $229k; 36% above their basis — modest negotiation headroom, anchor on the comps not their cost.
Questions for the listing agent
- What do current leases actually rent for vs. the listed asking? Can we see a recent rent roll and the last 12 months of T-12 income?
- What does the HOA fee cover, when was the last increase, and are there any pending special assessments or reserve-fund shortfalls?
- Is there a deadline driving the sale (1031 exchange, divorce, estate, relocation)? That informs how much negotiation room exists.
- Schools are D-rated, which usually means shorter tenancies and higher turnover. Who's the typical renter profile here, and what's been the actual vacancy rate?
- Crime grade is F in this area — have there been break-ins, vandalism, or insurance claims at this property in the last 3 years? What carrier currently insures it and at what premium?
- The area grade is low — what's the realistic commute time and amenity access for the typical tenant pool here? Any planned neighborhood developments (good or bad) we should know about?
- What's the average days-on-market for RENTAL listings here right now (not sales)? A rising rental-DOM trend means longer vacancies and softer asking-rent achievability than the comps imply.
- What's the recent tenant-quality profile in this submarket — average credit score on applications, eviction rate, late-payment / NSF rate, and stable-employment percentage? A property-management company in the area should have these aggregated.
- How much new for-sale + rental construction is in the pipeline within 1–3 miles? Heavy new supply typically softens prices + rents 12–24 months out; constrained supply supports both.
Investment metrics
- 1% rule
- 0.80% ✗
- Cap rate
- 6.26%
- Cash-on-cash
- -0.12%
- DSCR
- 0.99
- GRM
- 10.4
CMA / ARV
- ARV (median comp)
- $321,863
- List price
- $312,000
- Delta
- -3.06%
- Verdict
- FAIR
- Comps
- 20 within 1.0 mi
Show comp detail 12 sales within ~0.75 mi
| Address | Dist | Beds/Ba | Sqft | Sold | Price | $/sf | Match |
|---|---|---|---|---|---|---|---|
| 43421 Biscayne Dr | 0.05mi | 4/2.0 | 1,900 (-1%) | 2mo | $299,000 | $157 | 94 |
| 43460 Denali Dr | 0.10mi | 4/2.0 | 1,896 (-1%) | 2mo | $297,500 | $157 | 92 |
| 43459 Denali Dr | 0.13mi | 4/2.0 | 1,927 (+1%) | 8mo | $297,000 | $154 | 86 |
| 43449 Denali Dr | 0.11mi | 3/2.0 (-1) | 1,951 (+2%) | 1mo | $339,000 | $174 | 86 |
| 43357 Quiet Lake Dr | 0.25mi | 4/2.0 | 1,927 (+1%) | 10mo | $300,000 | $156 | 79 |
| 43264 S Coburn Loop | 0.60mi | 4/2.5 | 1,902 (-1%) | 3mo | $299,000 | $157 | 66 |
| 43450 Denali Dr | 0.08mi | 3/2.5 (-1) | 2,185 (+14%) | 9mo | $312,000 | $143 | 59 |
| 20049 Old Covington Hwy | 0.37mi | 3/2.0 (-1) | 1,784 (-7%) | 10mo | $212,000 | $119 | 58 |
| 20299 Camden Ln | 0.24mi | 3/2.5 (-1) | 2,185 (+14%) | 7mo | $305,000 | $140 | 52 |
| 43352 Rainier Dr | 0.44mi | 3/2.5 (-1) | 2,185 (+14%) | 4mo | $305,000 | $140 | 45 |
| 44368 Lake Wind Dr | 0.68mi | 4/3.0 | 2,175 (+14%) | 1mo | $349,865 | $161 | 41 |
| 44262 Lake Wind Dr | 0.68mi | 4/3.0 | 2,175 (+14%) | 4mo | $338,644 | $156 | 38 |
Match score weights: distance 35% · size 25% · config 20% · recency 20%. Top-matched comps best support the ARV.
Projected returns pro-forma
-3.0% appreciation · 0.33% rent growth · sell at horizon
- IRR
- -19.3%
- Equity multiple
- 0.34×
- Total profit
- $-57,751
- Equity at exit
- $46,520
- IRR
- -18.3%
- Equity multiple
- 0.12×
- Total profit
- $-76,814
- Equity at exit
- $26,976
Cash invested: $87,360 (down + closing). Projections, not guarantees.
Landlord ↔ Tenant lean methodology
- Overall (STATE)
- 90 Strongly Landlord-Friendly
- State Louisiana
- 90 Strongly Landlord-Friendly · R+12
- County
- — inherits STATE
- City
- — inherits STATE
ZIP-level market 70403
- Home prices YoY
- -34.1%
- Rents YoY
- 0.3%
- Active inventory
- 329
- Price-to-rent
- 10.4×
Monthly cashflow live
- Estimated rent
- $2,509 medium interval (Pro) →
- Mortgage (P&I)
- −$1,636
- Tax from tax record
- −$188 /mo · $2,257/yr
- Insurance
- −$130
- HOA
- −$37
- Vacancy / Maint / Mgmt
- −$527
- Net cashflow
- $-9
Break-even live
UW: 25.0% down · 7.5% · 30yr · 1.5% tax · 5.0% vac · 8.0% maint · 8.0% mgmt
Financing live
Cash to close
- Down payment
- $78,000
- Closing costs
- $9,360
- Reserves months
- —
- Total cash needed
- —
Loan-product check · same deal, 3 products live
Conventional
25% down · 7.5% · 30yr
- Down + closing
- —
- Monthly P&I
- —
- Monthly cashflow
- —
- DSCR
- —
- Eligible?
- —
Personal DTI + credit; lowest rate.
DSCR
20% down · 8.5% · 30yr
- Down + closing
- —
- Monthly P&I
- —
- Monthly cashflow
- —
- DSCR
- —
- Eligible?
- —
No personal income docs; deal must DSCR.
Hard money
10% down · 12.0% · 12mo
- Down + closing
- —
- Monthly P&I
- —
- Monthly cashflow
- —
- DSCR
- —
- Eligible?
- —
Short-term bridge; refi at stabilization.
Rent comps 4 comps
| Address | Beds | Baths | Sqft | Rent | $/sqft | DOM | Units | Dist |
|---|---|---|---|---|---|---|---|---|
| 20175 Kingland Dr Hammond, LA | 3.0 | 2.5 | 2300 | $2,300 | $1.00 | 43d | 1 | 0.17mi |
| 43293 Quiet Lake Dr Hammond, LA | 4.0 | 2.0 | 1850 | $3,840 | $2.08 | 43d | 1 | 0.34mi |
| 44243 Kendalwood Dr Hammond, LA | 3.0 | 2.0 | 1826 | $2,200 | $1.20 | 43d | 1 | 0.94mi |
| 19216 Dr John Lambert Dr Hammond, LA | 1.0–3.0 | 1.0–2.0 | 995 | $1,808 | $1.82 | 14d | 10 | 1.36mi |
HOA detail
- Monthly dues
- $37 · $444/yr
- Likely covers
- poolsecurity
Listing history 15 events
-
2026-04-29$312,000 Active 452-char remark
Show marketing remark (452 chars)
Outstanding 4BR/2BA home located in the desirable Woodlake Estates subdivision. Built in 2013, this home offers an inviting, spacious layout. Enjoy outdoor living with a covered patio and a fully fenced backyard, great for relaxing or entertaining. Additional features include a two-car garage, a security system, an outdoor shed, a community pool, and convenient access to nearby shopping, dining, and everyday essentials. Schedule your showing today!
-
2019-01-11soldstatus $228,900 Closed
-
2019-01-11soldstatus $228,900
-
2018-12-17status Pending
-
2018-12-12historical Pending Continue to Show
-
2018-11-30status Active
-
2018-11-29historical
-
2018-11-26price $229,900
-
2018-10-15$235,000 Active
-
2018-10-15$229,900
-
2013-06-28soldstatus $188,900
-
2013-01-28$188,900
-
2013-01-28$188,900
-
2006-10-18soldstatus $2,850,000
ⓘ Source: listings_history table (triggers on properties + properties_extension) + one-shot
backfill from property_details.listing_events for pre-trigger history.
Tax reassessment forecast LA · Resets to sale price
- Current annual tax
- $2,257 · $188/mo
- Projected year-2 tax
- $2,257 · $188/mo
- Expected delta
- $0/yr ($0/mo · 0.0%)
ⓘ Screening estimate from a state-policy table — verify with the county assessor before closing.
Nearby sold comps map
Loading sold comps map…
Walkable amenities ~0.75 mi
Loading nearby amenities…
Taxation est. · year 1
- Rental income
- $30,112
- − Mortgage interest
- −$17,477
- − Property taxes
- −$2,257
- − Insurance
- −$1,560
- − Repairs & maintenance
- −$2,409
- − Management
- −$2,409
- − HOA
- −$444
- − Depreciation
- −$9,076
- Taxable loss
- −$5,520
- Est. tax savings @ 24.0%
- +$1,325
- After-tax cash flow
- $1,219/yr
For passive investors: Depreciation is non-cash, so a rental often shows a tax loss while cash-flowing — sheltering income. Rental losses are passive: they offset passive income freely, and up to $25,000/yr can offset ordinary (W-2) income if you actively participate and your MAGI is under $100k (phasing out to $0 by $150k); unused losses carry forward. On sale, claimed depreciation is recaptured at up to 25%, and gains may owe capital-gains tax (a 1031 exchange can defer both). Figures are a year-1 estimate at your 24.0% rate — not tax advice; consult a CPA.
Schools (NCES district)
- District
- Tangipahoa Parish
- NCES district ID
- 2201680
- Math proficiency
- 18% ▼ -32.00%
- Reading proficiency
- 29% ▼ -31.00%
- Median HH income
- $41,283
- Composite
- 19.94/100
- National rank
- #8676
- State rank
- #63 of 98 in LA
Livability — Hammond
- Score
- 69/100
- State rank
- #77
- US rank
- #8868
Category grades
Schools grade is shown separately in the Schools card above.
Census & demographics
- County
- Tangipahoa Parish · 85,958 people
- City population
- 51,394
- Metro
- Hammond, LA
- Population (ZIP)
- 30,173
- Household income
- $50,976
- Rent vs Own
- Severe rent burden
- 1201.0
Population outlook (Tangipahoa County) Hauer SSP2
- Today (2025)
- 144,204 people
- By 2030
- 151,413 · +5.0%
- By 2040
- 164,374 · +14.0%
- By 2050
- 175,427 · +21.7%
- By 2075
- 195,165 · +35.3%
- By 2100
- 201,641 · +39.8%
Race, ethnicity, and origin ACS 2023
- Neighborhood character
- Diverse neighborhood (Simpson 0.56)
- Race & ethnicity
- White 55% Black 37% Hispanic / Latino 6% Two or more races 6%
- Hispanic origin (detail)
- Mexican 3%
- Common ancestry
- Lithuanian 9% Serbian 1% Slovak 1%
- Foreign-born
- 3% · Canada
- Languages at home
- 95% English-only · Spanish 4% Arabic 1%
Political lean MEDSL · Tangipahoa
- 2024 margin
- Solid R (+37.4) · D 30.6% · R 68.0% · Other 1.3%
- 2008→2024 swing
- -6.5pp toward R · 2008: -30.9pp · 2024: -37.4pp
- All cycles
- 2024: R+37.4 2020: R+32.8 2016: R+32.6 2012: R+27.7 2008: R+30.9
Not yet ingested
- Civics
- —
Market trends
- HPI YoY
- ▼ -66.04%
- Current HPI
- 127.4535
- Rent YoY
- ▲ 0.33%
- Metro
- Hammond, LA
- State GDP YoY
- ▲ 3.29%
- F500 in state
- 10
Industry mix (Fortune 500 HQ in LA)
| Industry | F500 HQs | Revenue |
|---|---|---|
| Telecommunications | 2 | $23B |
|
||
| Utilities | 1 | $12B |
|
||
| Wholesale / Distribution | 1 | $5B |
|
||
| Advertising | 1 | $2B |
|
||
Price history
-89.1% since first listed17 events — show timeline
- 2026-05-30 Pending — AcadianaMLS
- 2026-05-30 Pending — GSREIN
- 2026-04-29 Listed $312,000 GSREIN
- 2026-04-29 Listed $312,000 AcadianaMLS
- 2019-01-11 Sold (Public Records) $228,900 Public Records
- 2019-01-11 Sold (MLS) $228,900 GSREIN
- 2018-12-17 Pending — GSREIN
- 2018-12-12 Contingent — GSREIN
- 2018-11-30 Relisted — GSREIN
- 2018-11-29 Listing Removed — GSREIN
- 2018-11-26 Price Changed $229,900 GSREIN
- 2018-10-15 Listed $235,000 GSREIN
- 2018-10-15 Listed $229,900 AcadianaMLS
- 2013-06-28 Sold (MLS) $188,900 GSREIN
- 2013-01-28 Listed $188,900 AcadianaMLS
- 2013-01-28 Listed $188,900 GSREIN
- 2006-10-18 Sold (Public Records) $2,850,000 Public Records
Property tax history
+0.5%/yrLatest (2025): $2,257 · -0.5% YoY. Source: county tax records.
Cash-flow waterfall
monthlySold comps — $/sqft
last 12 mo · ≤1 miLoading sold comps…