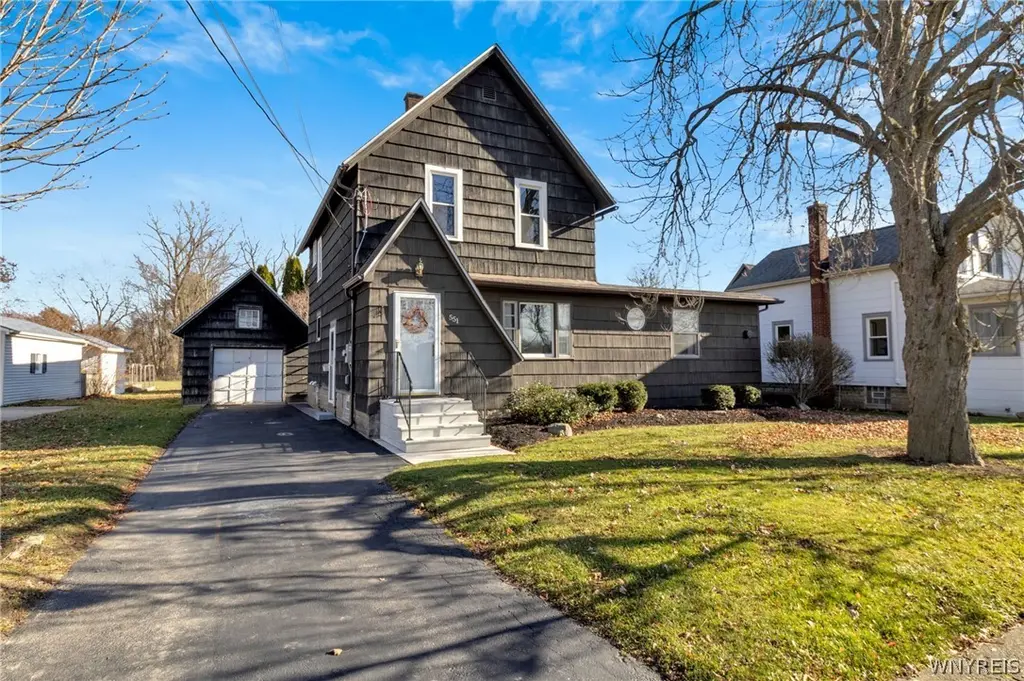
551 Wall St
North Tonawanda, NY 14120
$224,900C-
4 bd · 2.0 ba ·
1,682 sqft ·
Built 1900
· SingleFamily
· Pending
· 8 DOM
Cashflow @ list (25.0% down · 7.5%)
Estimated rent
$1,948/mo
Mortgage (P&I)
−$1,179
Tax + insurance
−$352
HOA
−$0
Vac / Maint / Mgmt
−$409
Net cashflow
$7/mo
Annual
$85/yr
Cap rate
6.33%
Cash-on-cash
0.13%
DSCR
1.01
1% rule
0.87%
Cash to close
$62,972
Investor read
- This is a 4-bed/2.0-bath single-family listed at $225k.
- At list price, monthly cash flow is $7 ($85/yr) — positive.
- The deal already cash-flows at list — no discount required.
- To meet the 1% rule (rent ≥ 1% of price), the offer needs to be $195k (13.4% below list).
- Only 8 days on market — expect competitive offers; lowballing is unlikely to land.
- Recommended offer: $195k (13.4% below list) — sets the bar for 1% rule.
- Local home prices are declining (-3.0%/yr); year-one equity from $2k of loan paydown is wiped out by about $7k of value loss. Plan a longer hold.
- Location reads 85/100 on livability (#30 in NY, #518 nationally) — a professional / high-income tenant draw. Strengths: commute A+, housing A+, health & safety A+.
- North Tonawanda City School District (suburban): math 42% / reading 57% proficiency, ranked #398 of 590 in NY (top 68%) — families likely to look elsewhere, expect single-tenant / working-renter base with shorter leases.
- Zoned schools: Ohio Elementary School (math 34% / reading 64%, grade D, #1,085 of 2,108 statewide, top 56%, 371 students, 0% FRL); North Tonawanda Middle School (math 27% / reading 52%, grade F, #418 of 729 statewide, top 59%, 447 students, 50% FRL); North Tonawanda High School (math 93% / reading 64%, grade A-, #562 of 1,100 statewide, top 51%, 1,001 students, 46% FRL) — zoned schools at 32% FRL track the district average.
- Watch-outs: built in 1900 — expect roof / HVAC / electrical / plumbing capex.
- Market conditions: Rents rising fast (+6.0%/yr); 180 active listings in the ZIP; 2 comparable units currently listed for rent nearby; 167 units permitted in Niagara County in 2024 (0 in 5+ unit buildings).
- Niagara County population projected at -19% by 2050 — secular population decline; favor cash flow + early exit over multi-decade hold.
- Cap rate 6.3% vs local median 4.0% in North Tonawanda — top-decile yield for the area; either an underpriced asset or a hidden risk that comps aren't pricing in. Stress-test before assuming the spread holds.
- This rent runs 31% of the median local income ($75k/yr) — at the standard rent-burdened threshold; future hikes will face affordability resistance.
Questions for listing agent
- Built in 1900 — when were the roof, HVAC, electrical panel, plumbing, and water heater last replaced?
- Is there a deadline driving the sale (1031 exchange, divorce, estate, relocation)? That informs how much negotiation room exists.
- Schools are B-rated — typically a magnet for longer-tenancy family renters. What's the average tenant stay here, and is there a school-zone premium baked into asking?
- What's the average days-on-market for RENTAL listings here right now (not sales)? A rising rental-DOM trend means longer vacancies and softer asking-rent achievability than the comps imply.
- What's the recent tenant-quality profile in this submarket — average credit score on applications, eviction rate, late-payment / NSF rate, and stable-employment percentage? A property-management company in the area should have these aggregated.
- How much new for-sale + rental construction is in the pipeline within 1–3 miles? Heavy new supply typically softens prices + rents 12–24 months out; constrained supply supports both.
CashFlowRE · CFR-FSQQ4B03EHA6JS
· Data 2 weeks ago
cashflowre.app · 2026-05-29