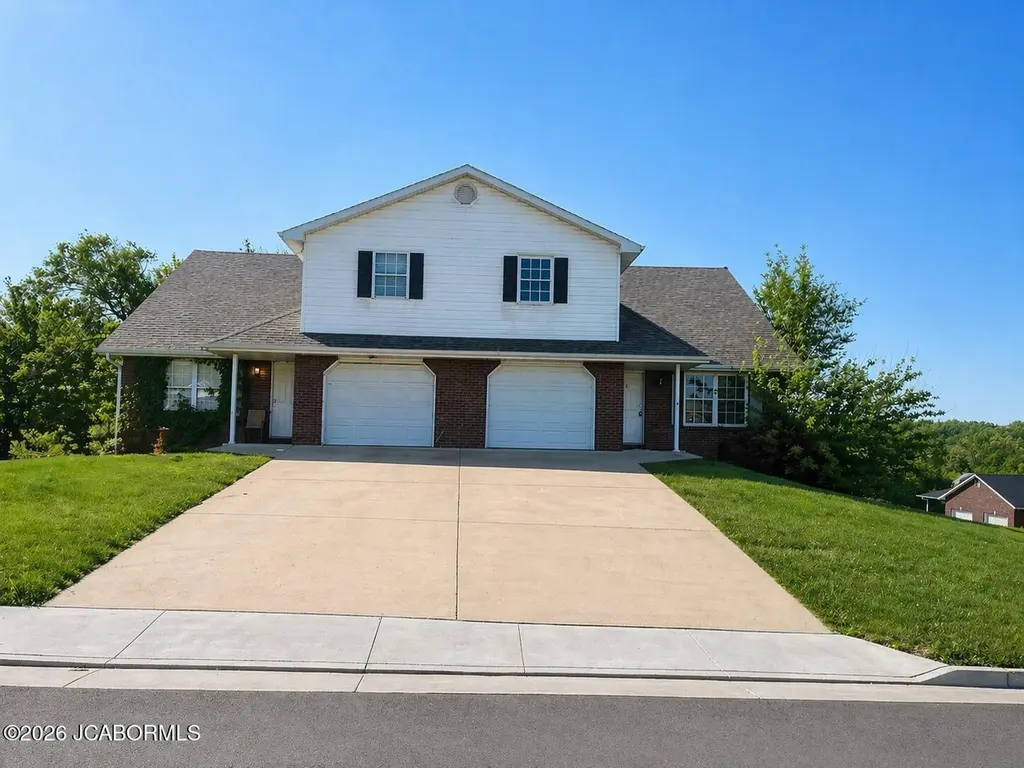
5119 Deer Rdg
St. Martins, MO 65109
$525,000D+
6 bd · 3.0 ba ·
4,702 sqft ·
Built 1998
· MultiFamily
· Active
· 56 DOM
Cashflow @ list (25.0% down · 7.5%)
Estimated rent
$4,671/mo
Mortgage (P&I)
−$2,753
Tax + insurance
−$433
HOA
−$0
Vac / Maint / Mgmt
−$981
Net cashflow
$504/mo
Annual
$6,051/yr
Cap rate
7.45%
Cash-on-cash
4.12%
DSCR
1.18
1% rule
0.89%
Cash to close
$147,000
Investor read
- This is a 4 × 2-bed/2.0-bath units multifamily listed at $525k.
- At list price, monthly cash flow is $504 ($6k/yr) — positive. Per door: $126/mo.
- The deal already cash-flows at list — no discount required.
- To meet the 1% rule (rent ≥ 1% of price), the offer needs to be $467k (11.0% below list).
- It's been on market 56 days — a 3% lower offer ($509k) is reasonable based on typical stale-listing flexibility.
- Recommended offer: $467k (11.0% below list) — sets the bar for 1% rule.
- Local home prices are declining (-3.0%/yr); year-one equity from $4k of loan paydown is wiped out by about $16k of value loss. Plan a longer hold.
- Location reads: area grade D — affects rentability + tenant quality, not the cash-flow math above.
- Jefferson City (urban): math 34% / reading 48% proficiency, ranked #121 of 324 in MO (top 37%) — families likely to look elsewhere, expect single-tenant / working-renter base with shorter leases.
- Market conditions: Rents rising fast (+10.2%/yr); 248 active listings in the ZIP; 173 units permitted in Cole County in 2024 (0 in 5+ unit buildings).
- Cole County population projected to shrink 5% by 2050 — rents likely to lag national; underwrite the cash flow, not the appreciation.
- 2 sale attempts since 5y ago with the ask held roughly flat each time — persistent listings suggest the price (not the market) is what's stuck; bring a comps-based counter.
- At projected returns (-3.0% appreciation + 8.0% rent growth), your $147k cash investment doubles in ~10 years — after that, you're playing with house money.
- At $4,671/mo this rent would consume 75% of the median local household income ($75k/yr) (locally 984% of renters already pay >50% of income on rent) — very limited rent-growth headroom before tenants either downsize or default.
Questions for listing agent
- It's been on market 56 days. Have you received any prior offers? Is the seller open to a 11% concession, seller financing, or rate buy-down credit?
- Can we see the unit-by-unit rent roll, current vacancy, and any below-market leases? What's the average tenancy length?
- What capital expenditures (roof, boiler, parking lot, exteriors) have been made in the last 5 years, and what's planned in the next 2?
- Is there a deadline driving the sale (1031 exchange, divorce, estate, relocation)? That informs how much negotiation room exists.
- The area grade is low — what's the realistic commute time and amenity access for the typical tenant pool here? Any planned neighborhood developments (good or bad) we should know about?
- What's the average days-on-market for RENTAL listings here right now (not sales)? A rising rental-DOM trend means longer vacancies and softer asking-rent achievability than the comps imply.
- What's the recent tenant-quality profile in this submarket — average credit score on applications, eviction rate, late-payment / NSF rate, and stable-employment percentage? A property-management company in the area should have these aggregated.
- How much new apartment / multifamily construction is in the pipeline within 1–3 miles? Heavy new supply (>2% of stock underway) typically softens rents 12–24 months out; light construction supports rent growth.
CashFlowRE · CFR-FSVR332APKWV9B
· Data 1 day ago
cashflowre.app · 2026-05-29