 Fourplex
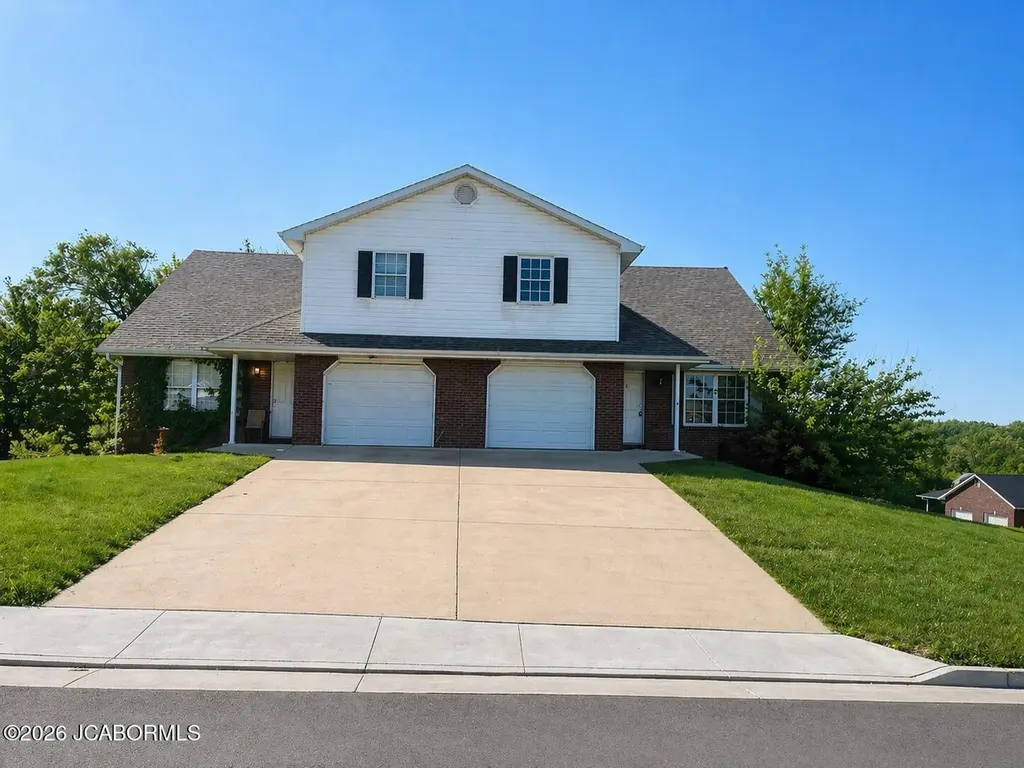
5119 Deer Rdg · St. Martins, MO
Flood risk 1/10 · Minimal
- FEMA flood zone
- X (unshaded)
- Chance of flooding over 30 yrs
- 0.0%
- Est. flood insurance / yr
- $473 – $860
Fire risk 2/10 · Minimal
- Est. fire insurance / yr
- $1,054 – $1,958
Heat risk 4/10 · Minor
- Hot days now (above 106°F)
- 7 days/yr
- Hot days in 30 yrs
- 19 days/yr
Wind risk 2/10 · Minimal
- Chance of severe wind over 30 yrs
- 0.0%
Air-quality risk 2/10 · Minimal
- Unhealthy air days now
- 0 days/yr
- Unhealthy air days in 30 yrs
- 1 days/yr
Risk factors via First Street. Map © Google.
Why this score? — see what drove the D+ grade
The composite is a weighted blend of 9 inputs, each scored 0–100. Each bar is that input's sub-score; the figure is the points it added to the 100-point composite (weight × sub-score).
- Cash flow +18.5/30.0
- ARV discount +7.5/15.0
- DSCR +5.8/10.0
- Rent growth +5.0/5.0
- 1% rule +3.9/10.0
- Schools +3.5/10.0
- Livability +2.5/5.0
- Condition / age +2.5/5.0
- Appreciation +0.0/10.0
$525,000
🖨 Deal sheet 📄 Offer letter ✓ Due diligence
Multi-family units
County records classify this as Multi-Family (2-4 Unit). Listing-text estimate: 4 units. confirmed
Listing remarks MLS
Amazing investment opportunity. Great rental history, well kept building in great location.
Key facts
- Partially updated
- Desirable unit mix
- Newer roof
Tags
Property features AI
Finance
- Financial info: Rented units with current actual rents: 2‑bed units reported at $850, $700 and $700; 2‑bed units also at $850 (various units); 3‑bed units reported at $1,200, $1,200, $1,200 and $1,200 (various units)
Exterior
- Parking: 2-car garage; Additional parking available
- Home design: Residential income property
- Construction: Brick and vinyl siding construction
- Exterior features: Deck; Patio; 0.3-acre lot
Interior
- Kitchen: No kitchen appliance details provided
- Bedrooms: Multiple units: 2‑bedroom and 3‑bedroom apartment types (several of each)
- Bathrooms: Eight full bathrooms (total)
- Heating & cooling: Central air conditioning; Forced air heating (electric)
- Interior features: Basement with walk-out access
- Laundry & utility: Laundry features listed as other
Neighborhood map
What this means for you Summary
Snapshot
- This is a 4 × 2-bed/2.0-bath units multifamily listed at $525k.
Deal economics
- At list price, monthly cash flow is $504 ($6k/yr) — positive. Per door: $126/mo.
- The deal already cash-flows at list — no discount required.
- To meet the 1% rule (rent ≥ 1% of price), the offer needs to be $467k (11.0% below list).
- Recommended offer: $467k (11.0% below list) — sets the bar for 1% rule.
Location & tenants
- Location reads: area grade D — affects rentability + tenant quality, not the cash-flow math above.
- Jefferson City (urban): math 34% / reading 48% proficiency, ranked #121 of 324 in MO (top 37%) — families likely to look elsewhere, expect single-tenant / working-renter base with shorter leases.
- Market conditions: Rents rising fast (+10.2%/yr); 248 active listings in the ZIP; 173 units permitted in Cole County in 2024 (0 in 5+ unit buildings).
- At $4,671/mo this rent would consume 75% of the median local household income ($75k/yr) (locally 984% of renters already pay >50% of income on rent) — very limited rent-growth headroom before tenants either downsize or default.
Forward outlook
- Local home prices are declining (-3.0%/yr); year-one equity from $4k of loan paydown is wiped out by about $16k of value loss. Plan a longer hold.
- Cole County population projected to shrink 5% by 2050 — rents likely to lag national; underwrite the cash flow, not the appreciation.
- At projected returns (-3.0% appreciation + 8.0% rent growth), your $147k cash investment doubles in ~10 years — after that, you're playing with house money.
Negotiation context
- It's been on market 56 days — a 3% lower offer ($509k) is reasonable based on typical stale-listing flexibility.
- 2 sale attempts since 5y ago with the ask held roughly flat each time — persistent listings suggest the price (not the market) is what's stuck; bring a comps-based counter.
Questions for the listing agent
- It's been on market 56 days. Have you received any prior offers? Is the seller open to a 11% concession, seller financing, or rate buy-down credit?
- Can we see the unit-by-unit rent roll, current vacancy, and any below-market leases? What's the average tenancy length?
- What capital expenditures (roof, boiler, parking lot, exteriors) have been made in the last 5 years, and what's planned in the next 2?
- Is there a deadline driving the sale (1031 exchange, divorce, estate, relocation)? That informs how much negotiation room exists.
- The area grade is low — what's the realistic commute time and amenity access for the typical tenant pool here? Any planned neighborhood developments (good or bad) we should know about?
- What's the average days-on-market for RENTAL listings here right now (not sales)? A rising rental-DOM trend means longer vacancies and softer asking-rent achievability than the comps imply.
- What's the recent tenant-quality profile in this submarket — average credit score on applications, eviction rate, late-payment / NSF rate, and stable-employment percentage? A property-management company in the area should have these aggregated.
- How much new apartment / multifamily construction is in the pipeline within 1–3 miles? Heavy new supply (>2% of stock underway) typically softens rents 12–24 months out; light construction supports rent growth.
Investment metrics
- 1% rule
- 0.89% ✗
- Cap rate
- 7.45%
- Cash-on-cash
- 4.12%
- DSCR
- 1.18
- GRM
- 9.4
CMA / ARV
No comps found within radius.
Projected returns pro-forma
-3.0% appreciation · 8.0% rent growth · sell at horizon
- IRR
- -5.0%
- Equity multiple
- 0.81×
- Total profit
- $-28,471
- Equity at exit
- $78,279
- IRR
- 9.4%
- Equity multiple
- 1.87×
- Total profit
- $128,098
- Equity at exit
- $45,392
Cash invested: $147,000 (down + closing). Projections, not guarantees.
Landlord ↔ Tenant lean methodology
- Overall (STATE)
- 81 Strongly Landlord-Friendly
- State Missouri
- 81 Strongly Landlord-Friendly · R+10
- County
- — inherits STATE
- City
- — inherits STATE
ZIP-level market 65109
- Home prices YoY
- -29.2%
- Rents YoY
- 10.2%
- Active inventory
- 248
- Price-to-rent
- 37.5×
Monthly cashflow live
- Estimated rent
- $4,671 medium interval (Pro) →
- Mortgage (P&I)
- −$2,753
- Tax from tax record
- −$214 /mo · $2,567/yr
- Insurance
- −$219
- HOA
- −$0
- Vacancy / Maint / Mgmt
- −$981
- Net cashflow
- $504
Break-even live
4-unit breakdown (identical units grouped — click to expand)
| Units | Beds | Baths | Est. rent |
|---|---|---|---|
| 4× units | 2 | 2 | $4,672 |
| #1 | 2 | 2 | $1,168 |
| #2 | 2 | 2 | $1,168 |
| #3 | 2 | 2 | $1,168 |
| #4 | 2 | 2 | $1,168 |
| Total (4 units) | $4,671 | ||
UW: 25.0% down · 7.5% · 30yr · 1.5% tax · 5.0% vac · 8.0% maint · 8.0% mgmt
Financing live
Cash to close
- Down payment
- $131,250
- Closing costs
- $15,750
- Reserves months
- —
- Total cash needed
- —
Loan-product check · same deal, 3 products live
Conventional
25% down · 7.5% · 30yr
- Down + closing
- —
- Monthly P&I
- —
- Monthly cashflow
- —
- DSCR
- —
- Eligible?
- —
Personal DTI + credit; lowest rate.
DSCR
20% down · 8.5% · 30yr
- Down + closing
- —
- Monthly P&I
- —
- Monthly cashflow
- —
- DSCR
- —
- Eligible?
- —
No personal income docs; deal must DSCR.
Hard money
10% down · 12.0% · 12mo
- Down + closing
- —
- Monthly P&I
- —
- Monthly cashflow
- —
- DSCR
- —
- Eligible?
- —
Short-term bridge; refi at stabilization.
Listing history 20 events
-
2026-06-19days on market $525,000 Active 56 DOM
-
2026-06-18days on market $525,000 Active 55 DOM
-
2026-06-17days on market $525,000 Active 54 DOM
-
2026-06-16days on market $525,000 Active 53 DOM
-
2026-06-15days on market $525,000 Active 52 DOM
-
2026-06-14days on market $525,000 Active 50 DOM
-
2026-06-13days on market $525,000 Active 49 DOM
-
2026-06-10days on market $525,000 Active 47 DOM
-
2026-06-09days on market $525,000 Active 46 DOM
-
2026-06-08days on market $525,000 Active 45 DOM
-
2026-06-07days on market $525,000 Active 44 DOM
-
2026-06-05days on market $525,000 Active 41 DOM
-
2026-06-03days on market $525,000 Active 40 DOM
-
2026-06-02days on market $525,000 Active 39 DOM
-
2026-06-01days on market $525,000 Active 38 DOM
-
2026-05-31days on market $525,000 Active 37 DOM
-
2026-05-30days on market $525,000 Active 36 DOM
-
2026-04-23$525,000 Active
-
2021-07-30soldstatus 91-char remark
Show marketing remark (91 chars)
Amazing investment opportunity. Great rental history, well kept building in great location.
-
2021-04-26$310,000 91-char remark
Show marketing remark (91 chars)
Amazing investment opportunity. Great rental history, well kept building in great location.
ⓘ Source: listings_history table (triggers on properties + properties_extension) + one-shot
backfill from property_details.listing_events for pre-trigger history.
Tax reassessment forecast MO · Resets to sale price
- Current annual tax
- $2,567 · $214/mo
- Projected year-2 tax
- $5,092 · $424/mo
- Expected delta
- +$2,526/yr (+$210/mo · 98.4%)
ⓘ Screening estimate from a state-policy table — verify with the county assessor before closing.
Climate risk First Street
- Flood 1/10 Low FEMA zone X (unshaded) · 0% chance over 30 yrs
- Wildfire 2/10 Low
- Heat 4/10 Moderate 7 d/yr ≥106°F today · 19 d/yr by 30 yrs out
- Wind 2/10 Low 0% chance of damaging wind over 30 yrs
- Air quality 2/10 Low 0 unhealthy d/yr today · 1 by 30 yrs out
Nearby sold comps map
Loading sold comps map…
Walkable amenities ~0.75 mi
Loading nearby amenities…
Taxation est. · year 1
- Rental income
- $56,052
- − Mortgage interest
- −$29,408
- − Property taxes
- −$2,567
- − Insurance
- −$2,625
- − Repairs & maintenance
- −$4,484
- − Management
- −$4,484
- − Depreciation
- −$15,273
- Taxable loss
- −$2,789
- Est. tax savings @ 24.0%
- +$669
- After-tax cash flow
- $6,721/yr
For passive investors: Depreciation is non-cash, so a rental often shows a tax loss while cash-flowing — sheltering income. Rental losses are passive: they offset passive income freely, and up to $25,000/yr can offset ordinary (W-2) income if you actively participate and your MAGI is under $100k (phasing out to $0 by $150k); unused losses carry forward. On sale, claimed depreciation is recaptured at up to 25%, and gains may owe capital-gains tax (a 1031 exchange can defer both). Figures are a year-1 estimate at your 24.0% rate — not tax advice; consult a CPA.
Schools (NCES district)
- District
- Jefferson City
- NCES district ID
- 2916190
- Math proficiency
- 34% ▼ -1.00%
- Reading proficiency
- 48% ▲ 5.00%
- Median HH income
- $51,903
- Composite
- 35.45/100
- National rank
- #4930
- State rank
- #121 of 324 in MO
Livability — St. Martins
No livability data for this city. (Only ~50 U.S. cities are tracked.)
Census & demographics
- County
- Cole County · 41,145 people
- Metro
- Jefferson City, MO
- Population (ZIP)
- 41,145
- Household income
- $74,694
- Rent vs Own
- Severe rent burden
- 984.0
Population outlook (Cole County) Hauer SSP2
- Today (2025)
- 78,107 people
- By 2030
- 78,089 · +-0.0%
- By 2040
- 76,814 · -1.7%
- By 2050
- 74,515 · -4.6%
- By 2075
- 67,687 · -13.3%
- By 2100
- 55,023 · -29.6%
Race, ethnicity, and origin ACS 2023
- Neighborhood character
- Predominantly White (82%)
- Race & ethnicity
- White 82% Black 7% Two or more races 5% Hispanic / Latino 4% Asian 3%
- Common ancestry
- Lithuanian 3% Italian 2% Slovak 2%
- Foreign-born
- 3% · Canada, China
- Languages at home
- 95% English-only · Spanish 1% Other Indo-European 1% Other Asian/Pacific 1%
Political lean MEDSL · Cole
- 2024 margin
- Solid R (+34.4) · D 32.1% · R 66.5% · Other 1.4%
- 2008→2024 swing
- -7.5pp toward R · 2008: -26.9pp · 2024: -34.4pp
- All cycles
- 2024: R+34.4 2020: R+33.9 2016: R+36.8 2012: R+33.7 2008: R+26.9
Not yet ingested
- Civics
- —
Market trends
- HPI YoY
- ▼ -83.14%
- Current HPI
- 202.01
- Rent YoY
- ▲ 10.19%
- Metro
- Jefferson City, MO
- State GDP YoY
- ▲ 1.84%
- F500 in state
- 20
Industry mix (Fortune 500 HQ in MO)
| Industry | F500 HQs | Revenue |
|---|---|---|
| Healthcare | 1 | $163B |
|
||
| Insurance | 1 | $21B |
|
||
| Industrial Technology | 1 | $17B |
|
||
| Retail | 1 | $16B |
|
||
| Industrial Distribution | 1 | $10B |
|
||
| Utilities | 1 | $9B |
|
||
Price history
+69.4% since first listed3 events — show timeline
- 2026-04-23 Listed $525,000 JCMLS
- 2021-07-30 Sold (MLS) — JCMLS
- 2021-04-26 Listed $310,000 JCMLS
Property tax history
+2.8%/yrLatest (2025): $2,567 · +5.3% YoY. Source: county tax records.
Cash-flow waterfall
monthlySold comps — $/sqft
last 12 mo · ≤1 miLoading sold comps…