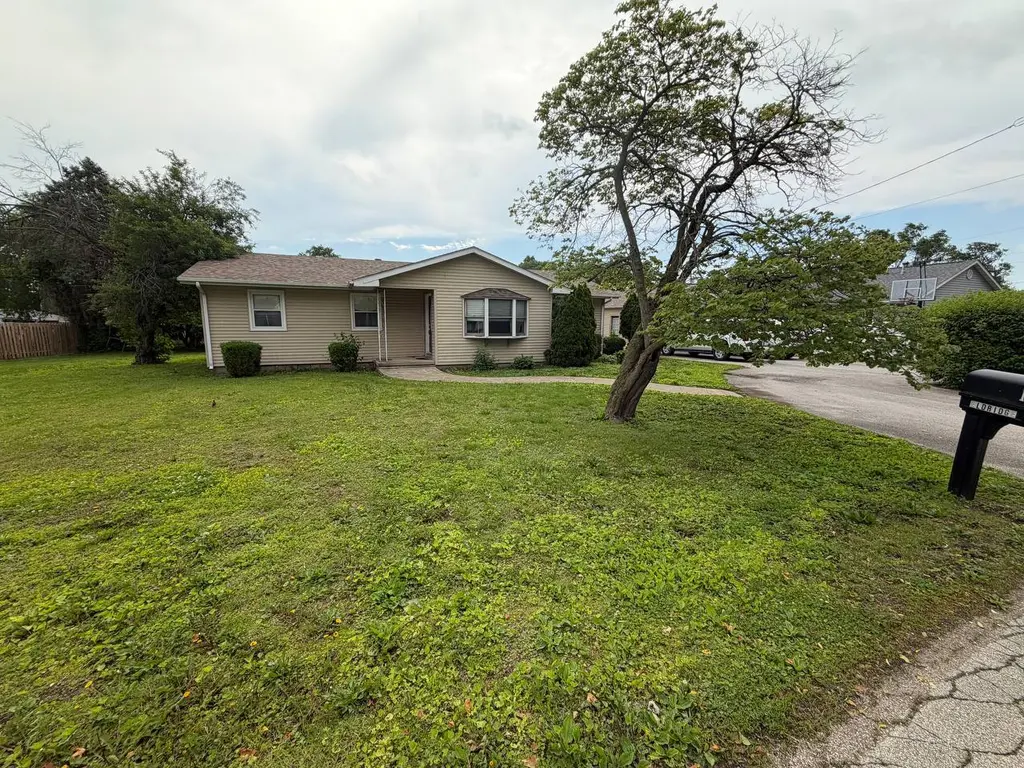
111 Orchard St
Catlin, IL 61817
$125,000D+
3 bd · 1.0 ba ·
1,280 sqft ·
Built 2005
· SingleFamily
· Active
· 11 DOM
Cashflow @ list (25.0% down · 7.5%)
Estimated rent
$961/mo
Mortgage (P&I)
−$656
Tax + insurance
−$300
HOA
−$0
Vac / Maint / Mgmt
−$202
Net cashflow
$-196/mo
Annual
$-2,354/yr
Cap rate
4.41%
Cash-on-cash
-6.73%
DSCR
0.70
1% rule
0.77%
Cash to close
$35,000
Investor read
- This is a 3-bed/1.0-bath single-family listed at $125k.
- At list price, monthly cash flow is $-196 ($-2k/yr) — negative.
- To cash-flow at today's rent, offer at most $90k (27.7% below list).
- To meet the 1% rule (rent ≥ 1% of price), the offer needs to be $96k (23.1% below list).
- Only 11 days on market — expect competitive offers; lowballing is unlikely to land.
- Recommended offer: $90k (27.7% below list) — sets the bar for cash-flow.
- In year one you build about $13k of equity ($864 loan paydown + $12k appreciation (10.0% local appreciation)).
- Location reads 67/100 on livability (#522 in IL) — a middle-class / working-renter tenant base. Strengths: crime A+, cost of living A+, housing A+; Watch: amenities F, commute F, health & safety F.
- Zoned schools: Salt Fork South Elementary School (math 8% / reading 12%, grade F, #1,517 of 2,056 statewide, top 78%, 164 students, 0% FRL); Salt Fork Junior High School (math 17% / reading 42%, grade F, #256 of 665 statewide, top 41%, 186 students, 0% FRL); Salt Fork High School (math 5% / reading 15%, grade F, #528 of 693 statewide, top 82%, 247 students, 0% FRL).
- Market conditions: 15 active listings in the ZIP; 2 comparable units currently listed for rent nearby; 8 units permitted in Vermilion County in 2024 (0 in 5+ unit buildings).
- Vermilion County population projected at -24% by 2050 — secular population decline; favor cash flow + early exit over multi-decade hold.
- Current owner paid $90k; 39% above their basis — modest negotiation headroom, anchor on the comps not their cost.
- By year 3, paydown + projected appreciation supports a ~$34k cash-out refi (75% LTV) — recoverable capital for the next deal without selling this one.
Questions for listing agent
- What do current leases actually rent for vs. the listed asking? Can we see a recent rent roll and the last 12 months of T-12 income?
- Is there a deadline driving the sale (1031 exchange, divorce, estate, relocation)? That informs how much negotiation room exists.
- Schools are D-rated, which usually means shorter tenancies and higher turnover. Who's the typical renter profile here, and what's been the actual vacancy rate?
- The area grade is low — what's the realistic commute time and amenity access for the typical tenant pool here? Any planned neighborhood developments (good or bad) we should know about?
- What's the average days-on-market for RENTAL listings here right now (not sales)? A rising rental-DOM trend means longer vacancies and softer asking-rent achievability than the comps imply.
- What's the recent tenant-quality profile in this submarket — average credit score on applications, eviction rate, late-payment / NSF rate, and stable-employment percentage? A property-management company in the area should have these aggregated.
- How much new for-sale + rental construction is in the pipeline within 1–3 miles? Heavy new supply typically softens prices + rents 12–24 months out; constrained supply supports both.
CashFlowRE · CFR-FT9ZPJCVH0X5AV
· Data 1 h ago
cashflowre.app · 2026-05-29