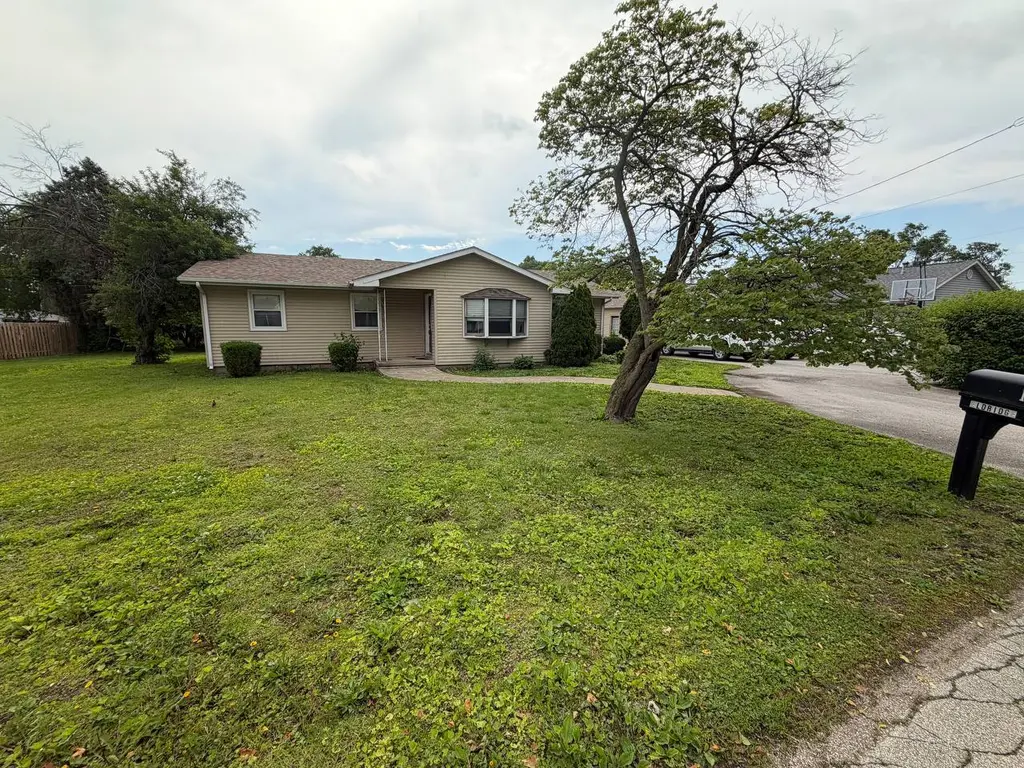
111 Orchard St · Catlin, IL
Flood risk 1/10 · Minimal
- FEMA flood zone
- X (unshaded)
- Chance of flooding over 30 yrs
- 0.0%
- Est. flood insurance / yr
- $473 – $860
Fire risk 1/10 · Minimal
- Est. fire insurance / yr
- $804 – $1,492
Heat risk 3/10 · Minor
- Hot days now (above 104°F)
- 7 days/yr
- Hot days in 30 yrs
- 18 days/yr
Wind risk 2/10 · Minimal
- Chance of severe wind over 30 yrs
- 1.0%
Air-quality risk 2/10 · Minimal
- Unhealthy air days now
- 1 days/yr
- Unhealthy air days in 30 yrs
- 2 days/yr
Risk factors via First Street. Map © Google.
Why this score? — see what drove the D+ grade
The composite is a weighted blend of 9 inputs, each scored 0–100. Each bar is that input's sub-score; the figure is the points it added to the 100-point composite (weight × sub-score).
- ARV discount +13.3/15.0
- Appreciation +10.0/10.0
- Cash flow +6.8/30.0
- Schools +5.0/10.0
- Livability +3.4/5.0
- 1% rule +2.7/10.0
- Rent growth +2.5/5.0
- Condition / age +2.5/5.0
- DSCR +1.0/10.0
$125,000
🖨 Deal sheet (PDF) 📄 Offer letter ✓ Due diligence
Listing remarks
Welcome to 111 Orchard St. in Catlin! This spacious 3-bedroom, 1-bath ranch offers approximately 1,280 sq ft of single-level living on a generous 0.43-acre lot. The home features a large living room, separate dining area, eat-in kitchen, first-floor laundry, and a functional open layout with plenty of room to make it your own. The kitchen offers ample cabinet and counter space and opens nicely to the dining and living areas, making everyday living and entertaining easy. Outside, enjoy nearly a half-acre with mature trees, a large yard, deck, patio, front porch, shed, and plenty of room to garden, play, entertain, or simply enjoy the outdoor space. The detached 2.5-car garage and long asphal
Key facts
- Large living room
- Open layout
- Eat-in kitchen
Tags
Property features AI
Finance
- Other: Lot dimensions approx. 130 x 143 (.25-.49 acre); Lot size source: county records; Zoning: single-family
- HOA & community: No master association fee required
Exterior
- Parking: Detached garage with garage door opener; Owned driveway; Asphalt surfaces; Approximately 2.5 garage spaces (listed); Approximately 12.5 total parking spaces (listed)
- Utilities: Public water; Public sewer; Electric service with circuit breakers
- Home design: Detached single-family home; One-story; Fee simple ownership; Built approximately 21-25 years ago; School bus service
- Construction: Vinyl siding; Asphalt roof; Concrete perimeter foundation
- Exterior features: Deck (20 x 13); Patio; Level lot; Curbs, sidewalks, paved streets
Interior
- Kitchen: Galley kitchen (15 x 10) with laminate flooring; Range; Dishwasher; Refrigerator
- Bedrooms: Master bedroom on main level (12 x 10) with carpet; Second bedroom on main level (12 x 10) with carpet; Third bedroom on main level (12 x 10) with carpet
- Flooring: Hardwood; Carpet; Laminate
- Bathrooms: One full bathroom with garden tub
- Heating & cooling: Natural gas heating; Central air conditioning
- Interior features: Open floorplan; First-floor bedroom; First-floor full bathroom; Storm door(s); Window screens; 7 total rooms; Unfinished attic; Crawl space basement; Separate dining room
- Laundry & utility: Main-level laundry (6 x 4) with gas dryer hookup, in-unit; Circuit breaker electric
Neighborhood map
What this means for you Summary
Snapshot
- This is a 3-bed/1.0-bath single-family listed at $125k.
Deal economics
- At list price, monthly cash flow is $-196 ($-2k/yr) — negative.
- To cash-flow at today's rent, offer at most $90k (27.7% below list).
- To meet the 1% rule (rent ≥ 1% of price), the offer needs to be $96k (23.1% below list).
- Recommended offer: $90k (27.7% below list) — sets the bar for cash-flow.
Location & tenants
- Location reads 67/100 on livability (#522 in IL) — a middle-class / working-renter tenant base. Strengths: crime A+, cost of living A+, housing A+; Watch: amenities F, commute F, health & safety F.
- Zoned schools: Salt Fork South Elementary School (math 8% / reading 12%, grade F, #1,517 of 2,056 statewide, top 78%, 164 students, 0% FRL); Salt Fork Junior High School (math 17% / reading 42%, grade F, #256 of 665 statewide, top 41%, 186 students, 0% FRL); Salt Fork High School (math 5% / reading 15%, grade F, #528 of 693 statewide, top 82%, 247 students, 0% FRL).
- Market conditions: 15 active listings in the ZIP; 2 comparable units currently listed for rent nearby; 8 units permitted in Vermilion County in 2024 (0 in 5+ unit buildings).
Forward outlook
- In year one you build about $13k of equity ($864 loan paydown + $12k appreciation (10.0% local appreciation)).
- Vermilion County population projected at -24% by 2050 — secular population decline; favor cash flow + early exit over multi-decade hold.
- By year 3, paydown + projected appreciation supports a ~$34k cash-out refi (75% LTV) — recoverable capital for the next deal without selling this one.
Negotiation context
- Only 11 days on market — expect competitive offers; lowballing is unlikely to land.
- Current owner paid $90k; 39% above their basis — modest negotiation headroom, anchor on the comps not their cost.
Questions for the listing agent
- What do current leases actually rent for vs. the listed asking? Can we see a recent rent roll and the last 12 months of T-12 income?
- Is there a deadline driving the sale (1031 exchange, divorce, estate, relocation)? That informs how much negotiation room exists.
- Schools are D-rated, which usually means shorter tenancies and higher turnover. Who's the typical renter profile here, and what's been the actual vacancy rate?
- The area grade is low — what's the realistic commute time and amenity access for the typical tenant pool here? Any planned neighborhood developments (good or bad) we should know about?
- What's the average days-on-market for RENTAL listings here right now (not sales)? A rising rental-DOM trend means longer vacancies and softer asking-rent achievability than the comps imply.
- What's the recent tenant-quality profile in this submarket — average credit score on applications, eviction rate, late-payment / NSF rate, and stable-employment percentage? A property-management company in the area should have these aggregated.
- How much new for-sale + rental construction is in the pipeline within 1–3 miles? Heavy new supply typically softens prices + rents 12–24 months out; constrained supply supports both.
Investment metrics
- 1% rule
- 0.77% ✗
- Cap rate
- 4.41%
- Cash-on-cash
- -6.73%
- DSCR
- 0.70
- GRM
- 10.8
CMA / ARV
- ARV (on-the-fly)
- $143,360
- Comps found
- 11
Show comp detail 11 sales within ~0.75 mi
| Address | Dist | Beds/Ba | Sqft | Sold | Price | $/sf | Match |
|---|---|---|---|---|---|---|---|
| 102 Huntington Park Dr | 0.43mi | 3/2.0 | 1,253 (-2%) | 4mo | $144,900 | $116 | 69 |
| 427 Merrill St | 0.46mi | 3/2.0 | 1,353 (+6%) | 4mo | $175,000 | $129 | 62 |
| 114 Paris St | 0.40mi | 3/1.0 | 1,404 (+10%) | 6mo | $101,500 | $72 | 60 |
| 108 W Fleming St | 0.35mi | 3/2.0 | 1,300 (+2%) | 23mo | $134,900 | $104 | 58 |
| 108 W Fleming St | 0.35mi | 3/2.0 | 1,300 (+2%) | 23mo | $134,900 | $104 | 58 |
| 424 Merrill St | 0.43mi | 3/2.0 | 1,215 (-5%) | 13mo | $135,000 | $111 | 57 |
| 108 Coronado | 0.45mi | 3/1.0 | 1,326 (+4%) | 19mo | $148,500 | $112 | 57 |
| 12735 Catlin Tilton Rd | 0.64mi | 3/1.5 | 1,356 (+6%) | 8mo | $162,500 | $120 | 52 |
| 114 Mapleleaf Dr | 0.51mi | 3/2.0 | 1,442 (+13%) | 2mo | $213,900 | $148 | 49 |
| 103 Taylor Ct | 0.68mi | 3/2.0 | 1,360 (+6%) | 10mo | $179,900 | $132 | 46 |
| 104 Taylor Ct | 0.61mi | 3/2.0 | 1,371 (+7%) | 13mo | $90,750 | $66 | 45 |
Match score weights: distance 35% · size 25% · config 20% · recency 20%. Top-matched comps best support the ARV.
Projected returns pro-forma
10.0% appreciation · 3.0% rent growth · sell at horizon
- IRR
- 19.5%
- Equity multiple
- 2.59×
- Total profit
- $55,653
- Equity at exit
- $112,610
- IRR
- 18.0%
- Equity multiple
- 5.97×
- Total profit
- $173,857
- Equity at exit
- $242,848
Cash invested: $35,000 (down + closing). Projections, not guarantees.
Landlord ↔ Tenant lean methodology
- Overall (STATE)
- 43 Moderately Tenant-Leaning
- State Illinois
- 43 Moderately Tenant-Leaning · D+7
- County
- — inherits STATE
- City
- — inherits STATE
ZIP-level market 61817
- Home prices YoY
- 10.2%
- Active inventory
- 15
- Price-to-rent
- 10.8×
Monthly cashflow live
- Estimated rent
- $961 medium interval (Pro) →
- Mortgage (P&I)
- −$656
- Tax from tax record
- −$248 /mo · $2,977/yr
- Insurance
- −$52
- HOA
- −$0
- Vacancy / Maint / Mgmt
- −$202
- Net cashflow
- $-196
Break-even live
Sensitivity live
| Price | -10% $-125 | -5% $-161 | +0% $-196 | +5% $-232 | +10% $-267 |
|---|---|---|---|---|---|
| Rent | -10% $-272 | -5% $-234 | +0% $-196 | +5% $-158 | +10% $-120 |
| Rate | -1.0pp $-133 | -0.5pp $-164 | base $-196 | +0.5pp $-229 | +1.0pp $-262 |
UW: 25.0% down · 7.5% · 30yr · 1.5% tax · 5.0% vac · 8.0% maint · 8.0% mgmt
Financing live
Cash to close
- Down payment
- $31,250
- Closing costs
- $3,750
- Reserves months
- —
- Total cash needed
- —
Loan-product check · same deal, 3 products live
Conventional
25% down · 7.5% · 30yr
- Down + closing
- —
- Monthly P&I
- —
- Monthly cashflow
- —
- DSCR
- —
- Eligible?
- —
Personal DTI + credit; lowest rate.
DSCR
20% down · 8.5% · 30yr
- Down + closing
- —
- Monthly P&I
- —
- Monthly cashflow
- —
- DSCR
- —
- Eligible?
- —
No personal income docs; deal must DSCR.
Hard money
10% down · 12.0% · 12mo
- Down + closing
- —
- Monthly P&I
- —
- Monthly cashflow
- —
- DSCR
- —
- Eligible?
- —
Short-term bridge; refi at stabilization.
Rent comps 2 comps
| Address | Beds | Baths | Sqft | Rent | $/sqft | DOM | Units | Dist |
|---|---|---|---|---|---|---|---|---|
| 203 Wabash Ave Catlin, IL | 3.0 | 1.0 | 1150 | $950 | $0.83 | 45d | 1 | 0.08mi |
| 211 Martin Ct Apt A Catlin, IL | 2.0 | 1.5 | 990 | $975 | $0.98 | 4d | 1 | 0.10mi |
Listing history 9 events
-
2026-06-22days on market $125,000 Active 11 DOM
-
2026-06-19days on market $125,000 Active 8 DOM
-
2026-06-18days on market $125,000 Active 7 DOM
-
2026-06-17days on market $125,000 Active 6 DOM
-
2026-06-16days on market $125,000 Active 5 DOM
-
2026-06-15days on market $125,000 Active 4 DOM
-
2026-06-14days on market $125,000 Active 2 DOM
-
2026-06-12remarks 699-char remark
-
2026-06-12$125,000 Active 1 DOM
ⓘ Source: listings_history table (triggers on properties + properties_extension) + one-shot
backfill from property_details.listing_events for pre-trigger history.
Tax reassessment forecast IL · Partial reset (capped growth)
- Current annual tax
- $2,977 · $248/mo
- Projected year-2 tax
- $2,977 · $248/mo
- Expected delta
- $0/yr ($0/mo · 0.0%)
ⓘ Screening estimate from a state-policy table — verify with the county assessor before closing.
Climate risk First Street
- Flood 1/10 Low FEMA zone X (unshaded) · 0% chance over 30 yrs
- Wildfire 1/10 Low
- Heat 3/10 Moderate 7 d/yr ≥104°F today · 18 d/yr by 30 yrs out
- Wind 2/10 Low 100% chance of damaging wind over 30 yrs
- Air quality 2/10 Low 1 unhealthy d/yr today · 2 by 30 yrs out
Nearby sold comps map
Loading sold comps map…
Walkable amenities ~0.75 mi
Loading nearby amenities…
Taxation est. · year 1
- Rental income
- $11,536
- − Mortgage interest
- −$7,002
- − Property taxes
- −$2,977
- − Insurance
- −$625
- − Repairs & maintenance
- −$923
- − Management
- −$923
- − Depreciation
- −$3,636
- Taxable loss
- −$4,550
- Est. tax savings @ 24.0%
- +$1,092
- After-tax cash flow
- $-1,262/yr
For passive investors: Depreciation is non-cash, so a rental often shows a tax loss while cash-flowing — sheltering income. Rental losses are passive: they offset passive income freely, and up to $25,000/yr can offset ordinary (W-2) income if you actively participate and your MAGI is under $100k (phasing out to $0 by $150k); unused losses carry forward. On sale, claimed depreciation is recaptured at up to 25%, and gains may owe capital-gains tax (a 1031 exchange can defer both). Figures are a year-1 estimate at your 24.0% rate — not tax advice; consult a CPA.
Schools (NCES district)
No district data.
Livability — Catlin
- Score
- 67/100
- State rank
- #522
- US rank
- #10766
Category grades
Schools grade is shown separately in the Schools card above.
Census & demographics
- Census place
- Catlin, IL
- Population (ZIP)
- 2,447
Population outlook (Vermilion County) Hauer SSP2
- Today (2025)
- 72,775 people
- By 2030
- 69,235 · -4.9%
- By 2040
- 62,360 · -14.3%
- By 2050
- 55,539 · -23.7%
- By 2075
- 40,606 · -44.2%
- By 2100
- 26,985 · -62.9%
Race, ethnicity, and origin ACS 2023
- Neighborhood character
- Predominantly White (92%)
- Race & ethnicity
- White 92% Hispanic / Latino 6% Two or more races 1% Black 1%
- Hispanic origin (detail)
- Mexican 4% Cuban 2%
- Common ancestry
- Slovak 5% Iranian 2% Lithuanian 1%
- Foreign-born
- 4% · Canada
- Languages at home
- 96% English-only · Spanish 4%
Political lean MEDSL · Vermilion
- 2024 margin
- Solid R (+35.7) · D 31.4% · R 67.0% · Other 1.6%
- 2008→2024 swing
- -36.2pp toward R · 2008: 0.6pp · 2024: -35.7pp
- All cycles
- 2024: R+35.7 2020: R+32.9 2016: R+29.2 2012: R+15.7 2008: D+0.6
Not yet ingested
- Civics
- —
Market trends
- HPI YoY
- ▲ 24.05%
- Current HPI
- 260.408
- Rent YoY
- —
- Metro
- —
- State GDP YoY
- ▲ 1.59%
- F500 in state
- 60
Industry mix (Fortune 500 HQ in IL)
| Industry | F500 HQs | Revenue |
|---|---|---|
| Insurance | 4 | $201B |
|
||
| Consumer Goods | 4 | $87B |
|
||
| Industrial Machinery | 3 | $64B |
|
||
| Healthcare | 2 | $55B |
|
||
| Retail / Pharmacy | 1 | $148B |
|
||
| Agriculture / Food | 1 | $86B |
|
||
Price history
+56.2% since first listed3 events — show timeline
- 2026-06-11 Listed $125,000 MRED as Distributed by MLS Grid
- 2012-09-28 Sold (Public Records) $90,000 Public Records
- 2005-11-01 Sold (Public Records) $80,000 Public Records
Property tax history
+4.6%/yrLatest (2024): $2,977 · +8.7% YoY. Source: county tax records.
Cash-flow waterfall
monthlySold comps — $/sqft
last 12 mo · ≤1 miLoading sold comps…