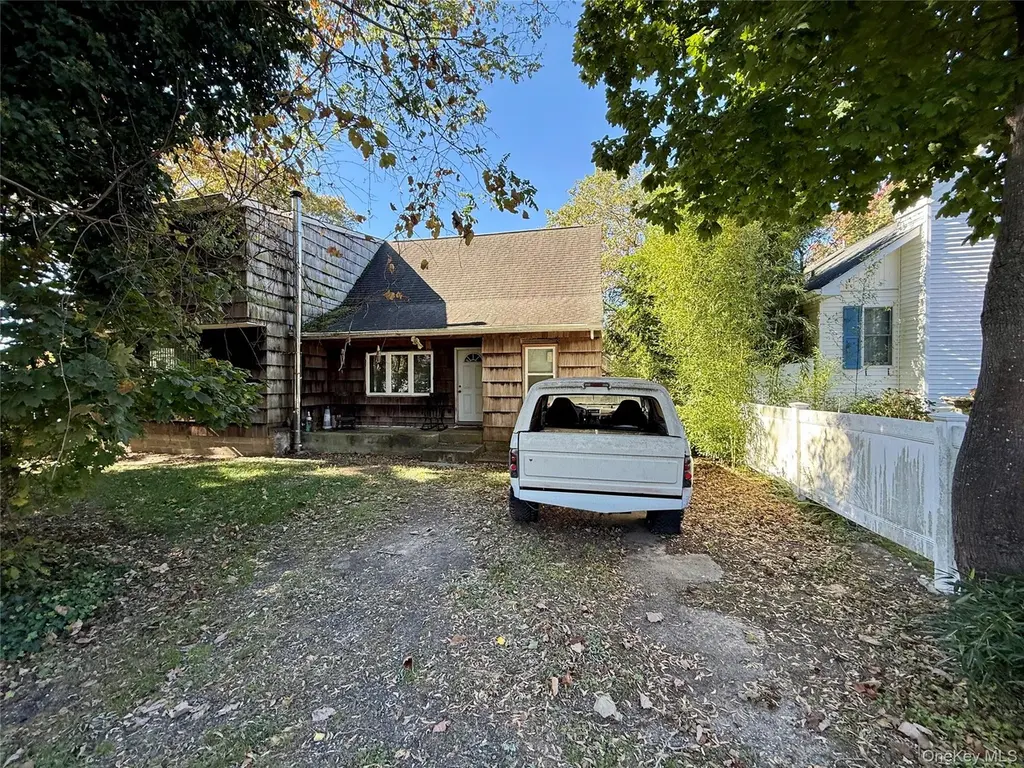
5 8th St
Sound Beach, NY 11789
$399,999D
4 bd · 2.0 ba ·
1,264 sqft ·
Built 1936
· SingleFamily
· Active
· 35 DOM
Cashflow @ list (25.0% down · 7.5%)
Estimated rent
$3,200/mo
Mortgage (P&I)
−$2,098
Tax + insurance
−$689
HOA
−$0
Vac / Maint / Mgmt
−$672
Net cashflow
$-258/mo
Annual
$-3,100/yr
Cap rate
5.52%
Cash-on-cash
-2.77%
DSCR
0.88
1% rule
0.80%
Cash to close
$112,000
Investor read
- This is a 4-bed/2.0-bath single-family listed at $400k.
- At list price, monthly cash flow is $-258 ($-3k/yr) — negative.
- To cash-flow at today's rent, offer at most $354k (11.4% below list).
- To meet the 1% rule (rent ≥ 1% of price), the offer needs to be $320k (20.0% below list).
- It's been on market 35 days — a 3% lower offer ($388k) is reasonable based on typical stale-listing flexibility.
- Recommended offer: $320k (20.0% below list) — sets the bar for 1% rule.
- Local home prices are declining (-3.0%/yr); year-one equity from $3k of loan paydown is wiped out by about $12k of value loss. Plan a longer hold.
- Location reads 70/100 on livability (#458 in NY) — a middle-class / working-renter tenant base. Strengths: employment A+, housing A+, crime B; Watch: schools D+, amenities F, commute F.
- Rocky Point Union Free School District (suburban): math 67% / reading 64% proficiency, ranked #152 of 590 in NY (top 26%) — acceptable for families but not a draw, mixed tenant base, ~2y average lease; only 19% free/reduced lunch — higher-income household profile.
- Watch-outs: built in 1936 — expect roof / HVAC / electrical / plumbing capex.
- Market conditions: 71 active listings in the ZIP; 1 comparable units currently listed for rent nearby; 1,366 units permitted in Suffolk County in 2024 (216 in 5+ unit buildings).
- Suffolk County population projected to shrink 5% by 2050 — rents likely to lag national; underwrite the cash flow, not the appreciation.
- 2 sale attempts with the ask held roughly flat each time — persistent listings suggest the price (not the market) is what's stuck; bring a comps-based counter.
- Climate carrying-cost: severe wind risk, 80% chance of damaging wind over 30y; extreme-heat days projected 7→15/yr by 2055 (HVAC capex compounding) — expect insurance premiums to compound above CPI over the hold.
- Cap rate 5.5% vs local median 3.8% in Sound Beach — top-decile yield for the area; either an underpriced asset or a hidden risk that comps aren't pricing in. Stress-test before assuming the spread holds.
Questions for listing agent
- What do current leases actually rent for vs. the listed asking? Can we see a recent rent roll and the last 12 months of T-12 income?
- It's been on market 35 days. Have you received any prior offers? Is the seller open to a 20% concession, seller financing, or rate buy-down credit?
- Built in 1936 — when were the roof, HVAC, electrical panel, plumbing, and water heater last replaced?
- Is there a deadline driving the sale (1031 exchange, divorce, estate, relocation)? That informs how much negotiation room exists.
- Schools are D-rated, which usually means shorter tenancies and higher turnover. Who's the typical renter profile here, and what's been the actual vacancy rate?
- The area grade is low — what's the realistic commute time and amenity access for the typical tenant pool here? Any planned neighborhood developments (good or bad) we should know about?
- What's the average days-on-market for RENTAL listings here right now (not sales)? A rising rental-DOM trend means longer vacancies and softer asking-rent achievability than the comps imply.
- What's the recent tenant-quality profile in this submarket — average credit score on applications, eviction rate, late-payment / NSF rate, and stable-employment percentage? A property-management company in the area should have these aggregated.
CashFlowRE · CFR-FTEFXDFEA4VHH6
· Data 2 weeks ago
cashflowre.app · 2026-05-29