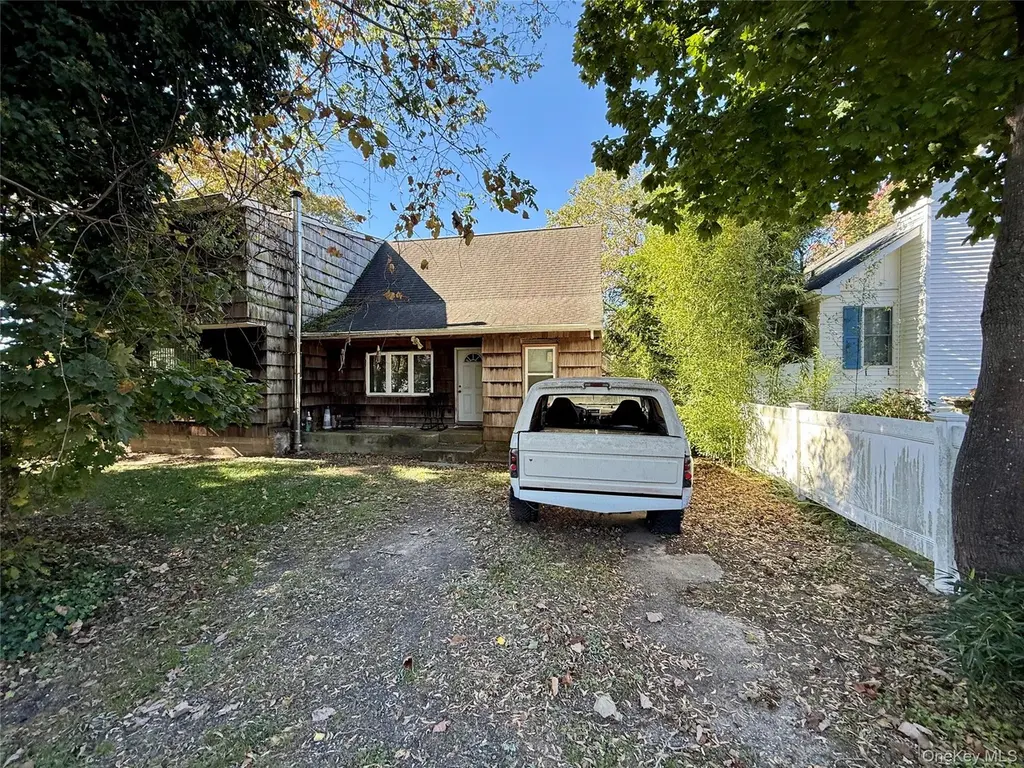
5 8th St · Sound Beach, NY
Flood risk 1/10 · Minimal
- FEMA flood zone
- X (unshaded)
- Chance of flooding over 30 yrs
- 0.0%
- Est. flood insurance / yr
- $473 – $860
Fire risk 3/10 · Minor
- Est. fire insurance / yr
- $691 – $1,283
Heat risk 5/10 · Moderate
- Hot days now (above 93°F)
- 7 days/yr
- Hot days in 30 yrs
- 15 days/yr
Wind risk 8/10 · Major
- Chance of severe wind over 30 yrs
- 80.0%
Air-quality risk 4/10 · Minor
- Unhealthy air days now
- 3 days/yr
- Unhealthy air days in 30 yrs
- 5 days/yr
Risk factors via First Street. Map © Google.
Why this score? — see what drove the D grade
The composite is a weighted blend of 9 inputs, each scored 0–100. Each bar is that input's sub-score; the figure is the points it added to the 100-point composite (weight × sub-score).
- ARV discount +15.0/15.0
- Cash flow +9.8/30.0
- Schools +5.9/10.0
- Livability +3.5/5.0
- 1% rule +3.0/10.0
- DSCR +2.8/10.0
- Rent growth +2.5/5.0
- Condition / age +2.5/5.0
- Appreciation +0.0/10.0
$399,999
🖨 Deal sheet 📄 Offer letter ✓ Due diligence
Listing remarks
Sold as-is. This home needs a full renovation but offers great potential to be transformed into a beautiful 4-bedroom, 2-bath Colonial. Located in the Rocky Point School District on a quiet corner flat property with . 29 acres and low taxes. Great opportunity for an investor, contractor, or end user looking to design and customize a home to their style. Conveniently located approximately 20 minutes from Stony Brook University Hospital, just 5 minutes from Scotts Beach, and offering easy access to Route 25A via North Country Road. CASH or 203k Rehab Loan. Addition for the living room, basement as well as the upstairs was completed 50 years ago without any C/O.
Key facts
- 0.29 acre lot
- Built 1936
- Listed 34 days
Property features AI
Exterior
- Parking: Unpaved parking
- Utilities: PSEG electric service; Cesspool sewer; Cable connected; Electricity connected; Public trash collection; Water connected
- Home design: Single-family home
- Construction: Frame construction; Block foundation
- Exterior features: Rain gutters; Back yard; Private yard; Front and rear sprinklers; Wood fencing
Interior
- Kitchen: Granite counters; Pantry; Breakfast bar; Microwave; Oven; Range
- Bedrooms: Includes a first-floor bedroom
- Flooring: Hardwood floors; Wood flooring
- Bathrooms: 2 full bathrooms
- Heating & cooling: Oil heating; No central air
- Interior features: First-floor bedroom; First-floor full bathroom; Breakfast bar; Granite counters; Pantry; Primary bathroom; Recessed lighting; Washer/dryer hookup; Unfinished walk-out basement; Porch
- Laundry & utility: Laundry located in basement; Washer/dryer hookup
Neighborhood map
What this means for you Summary
Snapshot
- This is a 4-bed/2.0-bath single-family listed at $400k.
Deal economics
- At list price, monthly cash flow is $-258 ($-3k/yr) — negative.
- To cash-flow at today's rent, offer at most $354k (11.4% below list).
- To meet the 1% rule (rent ≥ 1% of price), the offer needs to be $320k (20.0% below list).
- Recommended offer: $320k (20.0% below list) — sets the bar for 1% rule.
- Cap rate 5.5% vs local median 3.8% in Sound Beach — top-decile yield for the area; either an underpriced asset or a hidden risk that comps aren't pricing in. Stress-test before assuming the spread holds.
Location & tenants
- Location reads 70/100 on livability (#458 in NY) — a middle-class / working-renter tenant base. Strengths: employment A+, housing A+, crime B; Watch: schools D+, amenities F, commute F.
- Rocky Point Union Free School District (suburban): math 67% / reading 64% proficiency, ranked #152 of 590 in NY (top 26%) — acceptable for families but not a draw, mixed tenant base, ~2y average lease; only 19% free/reduced lunch — higher-income household profile.
- Market conditions: 70 active listings in the ZIP; 1 comparable units currently listed for rent nearby; 1,366 units permitted in Suffolk County in 2024 (216 in 5+ unit buildings).
Forward outlook
- Local home prices are declining (-3.0%/yr); year-one equity from $3k of loan paydown is wiped out by about $12k of value loss. Plan a longer hold.
- Suffolk County population projected to shrink 5% by 2050 — rents likely to lag national; underwrite the cash flow, not the appreciation.
Negotiation context
- It's been on market 35 days — a 3% lower offer ($388k) is reasonable based on typical stale-listing flexibility.
- 2 sale attempts with the ask held roughly flat each time — persistent listings suggest the price (not the market) is what's stuck; bring a comps-based counter.
Risks & watch-outs
- Watch-outs: built in 1936 — expect roof / HVAC / electrical / plumbing capex.
- Climate carrying-cost: severe wind risk, 80% chance of damaging wind over 30y; extreme-heat days projected 7→15/yr by 2055 (HVAC capex compounding) — expect insurance premiums to compound above CPI over the hold.
Questions for the listing agent
- What do current leases actually rent for vs. the listed asking? Can we see a recent rent roll and the last 12 months of T-12 income?
- It's been on market 35 days. Have you received any prior offers? Is the seller open to a 20% concession, seller financing, or rate buy-down credit?
- Built in 1936 — when were the roof, HVAC, electrical panel, plumbing, and water heater last replaced?
- Is there a deadline driving the sale (1031 exchange, divorce, estate, relocation)? That informs how much negotiation room exists.
- Schools are D-rated, which usually means shorter tenancies and higher turnover. Who's the typical renter profile here, and what's been the actual vacancy rate?
- The area grade is low — what's the realistic commute time and amenity access for the typical tenant pool here? Any planned neighborhood developments (good or bad) we should know about?
- What's the average days-on-market for RENTAL listings here right now (not sales)? A rising rental-DOM trend means longer vacancies and softer asking-rent achievability than the comps imply.
- What's the recent tenant-quality profile in this submarket — average credit score on applications, eviction rate, late-payment / NSF rate, and stable-employment percentage? A property-management company in the area should have these aggregated.
- How much new for-sale + rental construction is in the pipeline within 1–3 miles? Heavy new supply typically softens prices + rents 12–24 months out; constrained supply supports both.
Investment metrics
- 1% rule
- 0.80% ✗
- Cap rate
- 5.52%
- Cash-on-cash
- -2.77%
- DSCR
- 0.88
- GRM
- 10.4
CMA / ARV
- ARV (median comp)
- $639,096
- List price
- $399,999
- Delta
- -37.41%
- Verdict
- UNDERPRICED
- Comps
- 20 within 1.0 mi
Show comp detail 12 sales within ~0.75 mi
| Address | Dist | Beds/Ba | Sqft | Sold | Price | $/sf | Match |
|---|---|---|---|---|---|---|---|
| 24 Hempstead Dr | 0.09mi | 3/1.0 (-1) | 1,235 (-2%) | 13mo | $520,000 | $421 | 72 |
| 19 Belmont Rd | 0.60mi | 3/2.0 (-1) | 1,289 (+2%) | 2mo | $500,000 | $388 | 62 |
| 5 Tuckahoe Rd | 0.56mi | 3/2.0 (-1) | 1,260 (-0%) | 13mo | $586,000 | $465 | 58 |
| 100 Lynbrook Dr | 0.55mi | 3/1.0 (-1) | 1,282 (+1%) | 12mo | $515,000 | $402 | 53 |
| 110 Sound Beach Blvd | 0.33mi | 3/2.0 (-1) | 1,118 (-12%) | 10mo | $535,000 | $479 | 52 |
| 7 Commack Rd | 0.48mi | 3/3.0 (-1) | 1,200 (-5%) | 11mo | $534,000 | $445 | 51 |
| 20 Whitestone Rd #1486 | 0.55mi | 4/2.0 | 1,440 (+14%) | 4mo | $600,000 | $417 | 48 |
| 35 Beacon Dr | 0.74mi | 3/2.0 (-1) | 1,308 (+4%) | 11mo | $625,000 | $478 | 46 |
| 23 Malverne Rd | 0.65mi | 3/2.0 (-1) | 1,200 (-5%) | 13mo | $530,000 | $442 | 46 |
| 31 Brookhaven Dr | 0.73mi | 4/2.0 | 1,094 (-13%) | 4mo | $550,000 | $503 | 41 |
| 45 Brookhaven Dr | 0.74mi | 3/1.0 (-1) | 1,334 (+6%) | 13mo | $482,500 | $362 | 36 |
| 214 Harrison Ave | 0.65mi | 3/1.0 (-1) | 1,075 (-15%) | 5mo | $565,000 | $526 | 32 |
Match score weights: distance 35% · size 25% · config 20% · recency 20%. Top-matched comps best support the ARV.
Projected returns pro-forma
-3.0% appreciation · 3.0% rent growth · sell at horizon
- IRR
- -20.9%
- Equity multiple
- 0.27×
- Total profit
- $-81,210
- Equity at exit
- $59,641
- IRR
- -14.2%
- Equity multiple
- 0.18×
- Total profit
- $-91,652
- Equity at exit
- $34,585
Cash invested: $112,000 (down + closing). Projections, not guarantees.
Landlord ↔ Tenant lean methodology
- Overall (STATE)
- 15 Strongly Tenant-Friendly
- State New York
- 15 Strongly Tenant-Friendly · D+10
- County
- — inherits STATE
- City
- — inherits STATE
ZIP-level market 11789
- Home prices YoY
- -33.0%
- Active inventory
- 70
- Price-to-rent
- 10.4×
Monthly cashflow live
- Estimated rent
- $3,200 medium interval (Pro) →
- Mortgage (P&I)
- −$2,098
- Tax from tax record
- −$522 /mo · $6,265/yr
- Insurance
- −$167
- HOA
- −$0
- Vacancy / Maint / Mgmt
- −$672
- Net cashflow
- $-258
Break-even live
UW: 25.0% down · 7.5% · 30yr · 1.5% tax · 5.0% vac · 8.0% maint · 8.0% mgmt
Financing live
Cash to close
- Down payment
- $100,000
- Closing costs
- $12,000
- Reserves months
- —
- Total cash needed
- —
Loan-product check · same deal, 3 products live
Conventional
25% down · 7.5% · 30yr
- Down + closing
- —
- Monthly P&I
- —
- Monthly cashflow
- —
- DSCR
- —
- Eligible?
- —
Personal DTI + credit; lowest rate.
DSCR
20% down · 8.5% · 30yr
- Down + closing
- —
- Monthly P&I
- —
- Monthly cashflow
- —
- DSCR
- —
- Eligible?
- —
No personal income docs; deal must DSCR.
Hard money
10% down · 12.0% · 12mo
- Down + closing
- —
- Monthly P&I
- —
- Monthly cashflow
- —
- DSCR
- —
- Eligible?
- —
Short-term bridge; refi at stabilization.
Rent comps 1 comps
| Address | Beds | Baths | Sqft | Rent | $/sqft | DOM | Units | Dist |
|---|---|---|---|---|---|---|---|---|
| 96 Hallock Landing Rd Rocky Point, NY | 3.0 | 1.0 | 1254 | $3,200 | $2.55 | 44d | 1 | 1.45mi |
Listing history 5 events
-
2026-06-02days on market $399,999 Active 35 DOM
-
2026-06-01days on market $399,999 Active 34 DOM
-
2026-05-31days on market $399,999 Active 33 DOM
-
2026-04-22$399,999 Active 666-char remark
-
2025-10-27$399,999 Active
ⓘ Source: listings_history table (triggers on properties + properties_extension) + one-shot
backfill from property_details.listing_events for pre-trigger history.
Tax reassessment forecast NY · Partial reset (capped growth)
- Current annual tax
- $6,265 · $522/mo
- Projected year-2 tax
- $6,512 · $543/mo
- Expected delta
- +$248/yr (+$21/mo · 4.0%)
ⓘ Screening estimate from a state-policy table — verify with the county assessor before closing.
Climate risk First Street
- Flood 1/10 Low FEMA zone X (unshaded) · 0% chance over 30 yrs
- Wildfire 3/10 Moderate
- Heat 5/10 Major 7 d/yr ≥93°F today · 15 d/yr by 30 yrs out
- Wind 8/10 Severe 80% chance of damaging wind over 30 yrs
- Air quality 4/10 Moderate 3 unhealthy d/yr today · 5 by 30 yrs out
Nearby sold comps map
Loading sold comps map…
Walkable amenities ~0.75 mi
Loading nearby amenities…
Taxation est. · year 1
- Rental income
- $38,400
- − Mortgage interest
- −$22,406
- − Property taxes
- −$6,265
- − Insurance
- −$2,000
- − Repairs & maintenance
- −$3,072
- − Management
- −$3,072
- − Depreciation
- −$11,636
- Taxable loss
- −$10,051
- Est. tax savings @ 24.0%
- +$2,412
- After-tax cash flow
- $-688/yr
For passive investors: Depreciation is non-cash, so a rental often shows a tax loss while cash-flowing — sheltering income. Rental losses are passive: they offset passive income freely, and up to $25,000/yr can offset ordinary (W-2) income if you actively participate and your MAGI is under $100k (phasing out to $0 by $150k); unused losses carry forward. On sale, claimed depreciation is recaptured at up to 25%, and gains may owe capital-gains tax (a 1031 exchange can defer both). Figures are a year-1 estimate at your 24.0% rate — not tax advice; consult a CPA.
Schools (NCES district)
- District
- Rocky Point Union Free School District
- NCES district ID
- 3624840
- Math proficiency
- 67% ▼ -4.00%
- Reading proficiency
- 64% ▼ -7.00%
- Median HH income
- $86,256
- Composite
- 59.12/100
- National rank
- #953
- State rank
- #152 of 590 in NY
Livability — Sound Beach
- Score
- 70/100
- State rank
- #458
- US rank
- #7991
Category grades
Schools grade is shown separately in the Schools card above.
Census & demographics
- Census place
- Sound Beach, NY
- City population
- 7,447
- Population (ZIP)
- 7,447
Population outlook (Suffolk County) Hauer SSP2
- Today (2025)
- 1,505,262 people
- By 2030
- 1,498,318 · -0.5%
- By 2040
- 1,471,101 · -2.3%
- By 2050
- 1,424,848 · -5.3%
- By 2075
- 1,337,157 · -11.2%
- By 2100
- 1,217,720 · -19.1%
Race, ethnicity, and origin ACS 2023
- Neighborhood character
- Predominantly White (82%)
- Race & ethnicity
- White 82% Two or more races 11% Hispanic / Latino 9% Black 3%
- Hispanic origin (detail)
- Puerto Rican 1%
- Common ancestry
- Romanian 9% Slovak 6% Italian 3%
- Foreign-born
- 7% · Canada, Jamaica, China
- Languages at home
- 92% English-only · Spanish 4% Russian/Polish/Slavic 1% Other Asian/Pacific 1%
Political lean MEDSL · Suffolk
- 2024 margin
- Lean R (+10.0) · D 45.0% · R 55.0%
- 2008→2024 swing
- -16.0pp toward R · 2008: 6.0pp · 2024: -10.0pp
- All cycles
- 2024: R+10.0 2020: R+0.0 2016: R+8.2 2012: D+2.9 2008: D+6.0
Not yet ingested
- Civics
- —
Market trends
- HPI YoY
- ▼ -180.99%
- Current HPI
- 366.6474
- Rent YoY
- —
- Metro
- —
- State GDP YoY
- ▲ 2.60%
- F500 in state
- 92
Industry mix (Fortune 500 HQ in NY)
| Industry | F500 HQs | Revenue |
|---|---|---|
| Financial Services | 10 | $950B |
|
||
| Consumer Goods | 9 | $162B |
|
||
| Insurance | 4 | $225B |
|
||
| Telecommunications | 2 | $144B |
|
||
| Pharmaceuticals | 2 | $112B |
|
||
| Media / Entertainment | 2 | $69B |
|
||
Price history
+0.0% since first listed3 events — show timeline
- 2026-06-02 Listing Removed — OneKey® MLS as Distributed by MLS Grid
- 2026-04-22 Listed $399,999 OneKey® MLS as Distributed by MLS Grid
- 2025-10-27 Listed $399,999 OneKey® MLS as Distributed by MLS Grid
Property tax history
+2.4%/yrLatest (2025): $6,265 · +0.0% YoY. Source: county tax records.
Cash-flow waterfall
monthlySold comps — $/sqft
last 12 mo · ≤1 miLoading sold comps…