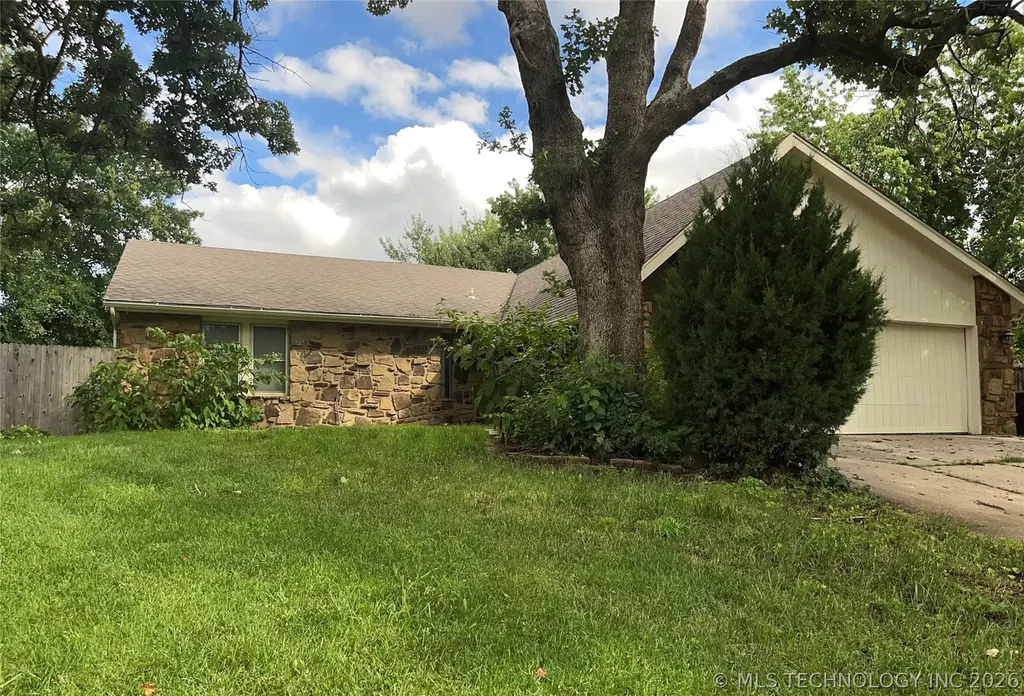
2309 W Jackson St
Broken Arrow, OK 74012
$215,000D+
3 bd · 2.0 ba ·
1,908 sqft ·
Built 1977
· SingleFamily
· Active
· 96 DOM
Cashflow @ list (25.0% down · 7.5%)
Estimated rent
$1,997/mo
Mortgage (P&I)
−$1,127
Tax + insurance
−$406
HOA
−$4
Vac / Maint / Mgmt
−$419
Net cashflow
$40/mo
Annual
$478/yr
Cap rate
6.52%
Cash-on-cash
0.79%
DSCR
1.04
1% rule
0.93%
Cash to close
$60,200
Investor read
- This is a 3-bed/2.0-bath single-family listed at $215k.
- At list price, monthly cash flow is $40 ($478/yr) — positive.
- The deal already cash-flows at list — no discount required.
- To meet the 1% rule (rent ≥ 1% of price), the offer needs to be $200k (7.1% below list).
- It's been on market 96 days — a 9% lower offer ($196k) is reasonable based on typical stale-listing flexibility.
- Recommended offer: $196k (9.0% below list) — sets the bar for market timing.
- Local home prices are declining (-3.0%/yr); year-one equity from $1k of loan paydown is wiped out by about $6k of value loss. Plan a longer hold.
- Location reads 78/100 on livability (#7 in OK, #2,691 nationally) — a middle-class / working-renter tenant base. Strengths: commute A+, cost of living A+, housing A+; Watch: amenities F.
- Union (urban): math 20% / reading 20% proficiency, ranked #160 of 270 in OK (top 59%) — low school quality limits family demand, transient renter base, plan for 1-2y turnover.
- Zoned schools: Peters Es (math 22% / reading 27%, grade F, #354 of 845 statewide, top 47%, 434 students, 0% FRL); Union 6Th-7Th Grade Ctr (math 18% / reading 17%, grade F, #186 of 345 statewide, top 55%, 2,182 students, 0% FRL); Union Hs (math 22% / reading 31%, grade F, #139 of 447 statewide, top 31%, 3,355 students, 0% FRL) — zoned schools average 0% FRL vs 51% district-wide (51 pts lower); this property's tenant base skews higher-income than the district average.
- Market conditions: Rents rising (+2.9%/yr); 445 active listings in the ZIP; 12 comparable units currently listed for rent nearby; rentals at typical pace (median 18d on market — plan ~3-4 weeks tenant-placement turnaround); solid renter incomes; 2,818 units permitted in Tulsa County in 2024 (518 in 5+ unit buildings).
- Tulsa County population projected at +30% by 2050 — long-run rental-demand tailwind backs the buy-and-hold thesis.
- 5 sale attempts since 18y ago with the ask held roughly flat each time — persistent listings suggest the price (not the market) is what's stuck; bring a comps-based counter.
- Climate carrying-cost: extreme-heat days projected 7→18/yr by 2055 (HVAC capex compounding) — expect insurance premiums to compound above CPI over the hold.
- Cap rate 6.5% vs local median 4.0% in Broken Arrow — top-decile yield for the area; either an underpriced asset or a hidden risk that comps aren't pricing in. Stress-test before assuming the spread holds.
Questions for listing agent
- It's been on market 96 days. Have you received any prior offers? Is the seller open to a 9% concession, seller financing, or rate buy-down credit?
- Built in 1977 — when were the roof, HVAC, electrical panel, plumbing, and water heater last replaced?
- What does the HOA fee cover, when was the last increase, and are there any pending special assessments or reserve-fund shortfalls?
- Why hasn't it sold? Are there any deal-killer items the seller is aware of (foundation, flood, title, zoning, code violations)?
- Is there a deadline driving the sale (1031 exchange, divorce, estate, relocation)? That informs how much negotiation room exists.
- Schools are D-rated, which usually means shorter tenancies and higher turnover. Who's the typical renter profile here, and what's been the actual vacancy rate?
- The area grade is low — what's the realistic commute time and amenity access for the typical tenant pool here? Any planned neighborhood developments (good or bad) we should know about?
- What's the average days-on-market for RENTAL listings here right now (not sales)? A rising rental-DOM trend means longer vacancies and softer asking-rent achievability than the comps imply.
CashFlowRE · CFR-FTZY2P6J3R1KXG
· Data 21 h ago
cashflowre.app · 2026-05-29