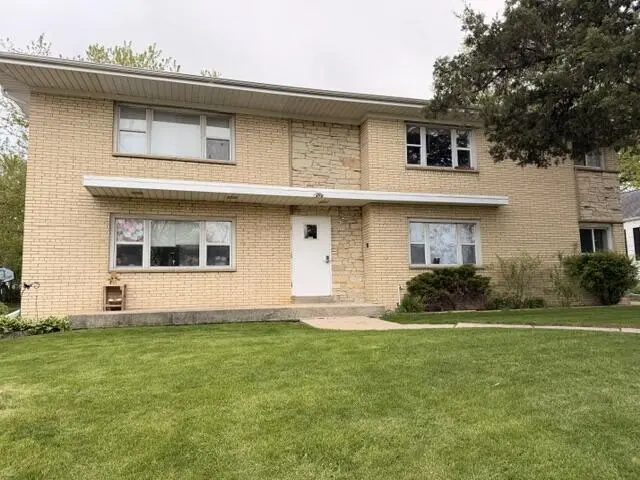
1950 S 98th St
West Allis, WI 53227
$674,900C+
None bd · None ba ·
4,500 sqft ·
Built 1961
· MultiFamily
· Pending
· 7 DOM
Cashflow @ list (25.0% down · 7.5%)
Estimated rent
$8,562/mo
Mortgage (P&I)
−$3,539
Tax + insurance
−$1,125
HOA
−$0
Vac / Maint / Mgmt
−$1,798
Net cashflow
$2,100/mo
Annual
$25,199/yr
Cap rate
10.03%
Cash-on-cash
13.33%
DSCR
1.59
1% rule
1.27%
Cash to close
$188,972
Investor read
- This is a 2×2bd/1ba + 4×1bd/1ba units multifamily listed at $675k. Condition is rated average.
- At list price, monthly cash flow is $2k ($25k/yr) — positive. Per door: $350/mo.
- The deal already cash-flows at list — no discount required.
- Meets the 1% rule at list price ($9k rent vs $675k).
- Only 7 days on market — expect competitive offers; lowballing is unlikely to land.
- Local home prices are declining (-3.0%/yr); year-one equity from $5k of loan paydown is wiped out by about $20k of value loss. Plan a longer hold.
- Location reads 79/100 on livability (#69 in WI, #1,958 nationally) — a middle-class / working-renter tenant base. Strengths: commute A+, cost of living A+, housing A+; Watch: amenities F.
- West Allis-West Milwaukee School District (urban): math 17% / reading 26% proficiency, ranked #328 of 342 in WI (top 96%) — low school quality limits family demand, transient renter base, plan for 1-2y turnover.
- Market conditions: 30 active listings in the ZIP; 1,017 units permitted in Milwaukee County in 2024 (803 in 5+ unit buildings).
- Milwaukee County population projected at +4% by 2050 — modest demand growth; plan on rents tracking national, not racing it.
- At projected returns (-3.0% appreciation + 3.0% rent growth), your $189k cash investment doubles in ~9 years — after that, you're playing with house money.
- Cap rate 10.0% vs local median 4.3% in West Allis — top-decile yield for the area; either an underpriced asset or a hidden risk that comps aren't pricing in. Stress-test before assuming the spread holds.
- At $8,562/mo this rent would consume 140% of the median local household income ($73k/yr) (locally 905% of renters already pay >50% of income on rent) — very limited rent-growth headroom before tenants either downsize or default.
Questions for listing agent
- Can we see the unit-by-unit rent roll, current vacancy, and any below-market leases? What's the average tenancy length?
- What capital expenditures (roof, boiler, parking lot, exteriors) have been made in the last 5 years, and what's planned in the next 2?
- Built in 1961 — when were the roof, HVAC, electrical panel, plumbing, and water heater last replaced?
- Is there a deadline driving the sale (1031 exchange, divorce, estate, relocation)? That informs how much negotiation room exists.
- What's the average days-on-market for RENTAL listings here right now (not sales)? A rising rental-DOM trend means longer vacancies and softer asking-rent achievability than the comps imply.
- What's the recent tenant-quality profile in this submarket — average credit score on applications, eviction rate, late-payment / NSF rate, and stable-employment percentage? A property-management company in the area should have these aggregated.
- How much new apartment / multifamily construction is in the pipeline within 1–3 miles? Heavy new supply (>2% of stock underway) typically softens rents 12–24 months out; light construction supports rent growth.
Repairs flagged (vision-AI assessment)
- Major: exterior siding — Significant discoloration and wear
- Major: roof — No photos of roof, but discoloration suggests potential issues
CashFlowRE · CFR-FVVT9Q5FCTF1KD
· Data 3 weeks ago
cashflowre.app · 2026-05-29