 6-Plex
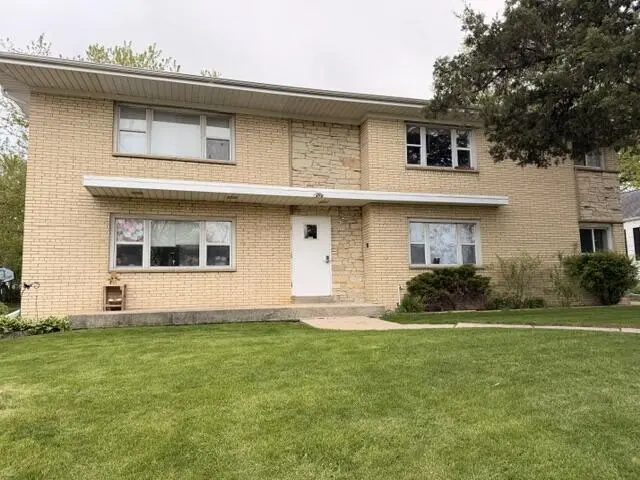
1950 S 98th St · West Allis, WI
Flood risk No data
- FEMA flood zone
- —
- Chance of flooding over 30 yrs
- —
- Est. flood insurance / yr
- —
Fire risk No data
- Est. fire insurance / yr
- —
Heat risk No data
- Hot days now (above threshold)
- —
- Hot days in 30 yrs
- —
Wind risk No data
- Chance of severe wind over 30 yrs
- —
Air-quality risk No data
- Unhealthy air days now
- —
- Unhealthy air days in 30 yrs
- —
Risk factors via First Street. Map © Google.
Why this score? — see what drove the C+ grade
The composite is a weighted blend of 9 inputs, each scored 0–100. Each bar is that input's sub-score; the figure is the points it added to the 100-point composite (weight × sub-score).
- Cash flow +28.0/30.0
- DSCR +9.9/10.0
- 1% rule +7.7/10.0
- ARV discount +7.5/15.0
- Livability +4.0/5.0
- Condition / age +2.8/5.0
- Rent growth +2.5/5.0
- Schools +1.9/10.0
- Appreciation +0.0/10.0
$674,900
🖨 Deal sheet 📄 Offer letter ✓ Due diligence
Multi-family units
County records classify this as Multi-Family (5+ Unit). Listing-text estimate: 6 units. confirmed
5+ unit building — per-unit beds/baths from public records are typically unavailable; the breakdown below (if shown) is an estimate from the listing text.
Listing remarks
Rare 6-unit building! Two 2 Bedroom units and four 1 bedroom units. Hardwood floors throughout each unit. Updated tile flooring and walls in each bathroom featuring pedestal sinks and exhaust fans. Great closet space in each bedroom. Kitchens include all appliances. Separate electric, furnaces and water heaters. All furnaces under 10 years old. Separate storage units and coin laundry. Parking for 6 cars plus storage shed in back.
Key facts
- Pedestal sinks
- Exhaust fans
- 6 unit building
Tags
Property features AI
Finance
- Other: Includes six ovens/ranges, six refrigerators, shelving in owner storage area
Exterior
- Parking: Outdoor parking; Indoor parking
- Utilities: Municipal water; Municipal sewer
- Home design: Multi-family property; Apartment building; 1-2 stories
- Construction: Brick and stone with vinyl elements
- Exterior features: Brick, stone and vinyl exterior; Lot size approximately 0.24 acres; Zoned RB
Interior
- Heating & cooling: Forced air heating; Individual heating units; Natural gas fuel
- Interior features: Full basement with block construction and laundry facilities; Six-unit building
- Laundry & utility: Seller-owned washer and dryer; Coin-operated washer and dryer available
Neighborhood map
What this means for you Summary
Snapshot
- This is a 2×2bd/1ba + 4×1bd/1ba units multifamily listed at $675k. Condition is rated average.
Deal economics
- At list price, monthly cash flow is $2k ($25k/yr) — positive. Per door: $350/mo.
- The deal already cash-flows at list — no discount required.
- Meets the 1% rule at list price ($9k rent vs $675k).
- Cap rate 10.0% vs local median 4.3% in West Allis — top-decile yield for the area; either an underpriced asset or a hidden risk that comps aren't pricing in. Stress-test before assuming the spread holds.
Location & tenants
- Location reads 79/100 on livability (#69 in WI, #1,958 nationally) — a middle-class / working-renter tenant base. Strengths: commute A+, cost of living A+, housing A+; Watch: amenities F.
- West Allis-West Milwaukee School District (urban): math 17% / reading 26% proficiency, ranked #328 of 342 in WI (top 96%) — low school quality limits family demand, transient renter base, plan for 1-2y turnover.
- Market conditions: 30 active listings in the ZIP; 1,017 units permitted in Milwaukee County in 2024 (803 in 5+ unit buildings).
- At $8,562/mo this rent would consume 140% of the median local household income ($73k/yr) (locally 905% of renters already pay >50% of income on rent) — very limited rent-growth headroom before tenants either downsize or default.
Forward outlook
- Local home prices are declining (-3.0%/yr); year-one equity from $5k of loan paydown is wiped out by about $20k of value loss. Plan a longer hold.
- Milwaukee County population projected at +4% by 2050 — modest demand growth; plan on rents tracking national, not racing it.
- At projected returns (-3.0% appreciation + 3.0% rent growth), your $189k cash investment doubles in ~9 years — after that, you're playing with house money.
Negotiation context
- Only 7 days on market — expect competitive offers; lowballing is unlikely to land.
Questions for the listing agent
- Can we see the unit-by-unit rent roll, current vacancy, and any below-market leases? What's the average tenancy length?
- What capital expenditures (roof, boiler, parking lot, exteriors) have been made in the last 5 years, and what's planned in the next 2?
- Built in 1961 — when were the roof, HVAC, electrical panel, plumbing, and water heater last replaced?
- Is there a deadline driving the sale (1031 exchange, divorce, estate, relocation)? That informs how much negotiation room exists.
- What's the average days-on-market for RENTAL listings here right now (not sales)? A rising rental-DOM trend means longer vacancies and softer asking-rent achievability than the comps imply.
- What's the recent tenant-quality profile in this submarket — average credit score on applications, eviction rate, late-payment / NSF rate, and stable-employment percentage? A property-management company in the area should have these aggregated.
- How much new apartment / multifamily construction is in the pipeline within 1–3 miles? Heavy new supply (>2% of stock underway) typically softens rents 12–24 months out; light construction supports rent growth.
Investment metrics
- 1% rule
- 1.27% ✓
- Cap rate
- 10.03%
- Cash-on-cash
- 13.33%
- DSCR
- 1.59
- GRM
- 6.6
CMA / ARV
No comps found within radius.
Projected returns pro-forma
-3.0% appreciation · 3.0% rent growth · sell at horizon
- IRR
- 3.4%
- Equity multiple
- 1.13×
- Total profit
- $24,510
- Equity at exit
- $100,630
- IRR
- 12.9%
- Equity multiple
- 2.03×
- Total profit
- $194,084
- Equity at exit
- $58,353
Cash invested: $188,972 (down + closing). Projections, not guarantees.
Landlord ↔ Tenant lean methodology
- Overall (STATE)
- 73 Landlord-Friendly
- State Wisconsin
- 73 Landlord-Friendly · R+2
- County
- — inherits STATE
- City
- — inherits STATE
ZIP-level market 53227
- Home prices YoY
- -29.2%
- Active inventory
- 30
- Price-to-rent
- 37.3×
Monthly cashflow live
- Estimated rent
- $8,562 high interval (Pro) →
- Mortgage (P&I)
- −$3,539
- Tax est. 1.5%
- −$844 /mo · $10,124/yr
- Insurance
- −$281
- HOA
- −$0
- Vacancy / Maint / Mgmt
- −$1,798
- Net cashflow
- $2,100
Break-even live
6-unit breakdown (identical units grouped — click to expand)
| Units | Beds | Baths | Est. rent |
|---|---|---|---|
| 2× units | 2 | 1 | $3,020 |
| #1 | 2 | 1 | $1,510 |
| #2 | 2 | 1 | $1,510 |
| 4× units | 1 | 1 | $5,544 |
| #3 | 1 | 1 | $1,386 |
| #4 | 1 | 1 | $1,386 |
| #5 | 1 | 1 | $1,386 |
| #6 | 1 | 1 | $1,386 |
| Total (6 units) | $8,562 | ||
UW: 25.0% down · 7.5% · 30yr · 1.5% tax · 5.0% vac · 8.0% maint · 8.0% mgmt
Financing live
Cash to close
- Down payment
- $168,725
- Closing costs
- $20,247
- Reserves months
- —
- Total cash needed
- —
Loan-product check · same deal, 3 products live
Conventional
25% down · 7.5% · 30yr
- Down + closing
- —
- Monthly P&I
- —
- Monthly cashflow
- —
- DSCR
- —
- Eligible?
- —
Personal DTI + credit; lowest rate.
DSCR
20% down · 8.5% · 30yr
- Down + closing
- —
- Monthly P&I
- —
- Monthly cashflow
- —
- DSCR
- —
- Eligible?
- —
No personal income docs; deal must DSCR.
Hard money
10% down · 12.0% · 12mo
- Down + closing
- —
- Monthly P&I
- —
- Monthly cashflow
- —
- DSCR
- —
- Eligible?
- —
Short-term bridge; refi at stabilization.
Listing history 1 events
-
2026-05-20$674,900 Active
ⓘ Source: listings_history table (triggers on properties + properties_extension) + one-shot
backfill from property_details.listing_events for pre-trigger history.
Nearby sold comps map
Loading sold comps map…
Walkable amenities ~0.75 mi
Loading nearby amenities…
Taxation est. · year 1
- Rental income
- $102,744
- − Mortgage interest
- −$37,805
- − Property taxes
- −$10,124
- − Insurance
- −$3,374
- − Repairs & maintenance
- −$8,220
- − Management
- −$8,220
- − Depreciation
- −$19,633
- Taxable income
- $15,369
- Est. tax owed @ 24.0%
- −$3,688
- After-tax cash flow
- $21,510/yr
For passive investors: Depreciation is non-cash, so a rental often shows a tax loss while cash-flowing — sheltering income. Rental losses are passive: they offset passive income freely, and up to $25,000/yr can offset ordinary (W-2) income if you actively participate and your MAGI is under $100k (phasing out to $0 by $150k); unused losses carry forward. On sale, claimed depreciation is recaptured at up to 25%, and gains may owe capital-gains tax (a 1031 exchange can defer both). Figures are a year-1 estimate at your 24.0% rate — not tax advice; consult a CPA.
Condition & rehab AI · 1 photo
A 6-unit building with good bathrooms and hardwood floors, but requires exterior repairs and roof replacement to improve its condition and value.
Repairs flagged
- Major exterior siding — Significant discoloration and wear
- Major roof — No photos of roof, but discoloration suggests potential issues
Value-add opportunities
- Both paint exterior — Enhances curb appeal and value
- Both replace roof — Critical to the home's structural integrity and value
- Both update HVAC system — Modernizes the system and improves comfort
Renovation cost estimate screening
| Repair item | Severity | Est. cost |
|---|---|---|
| exterior siding · Significant discoloration and wear | Major | $15,000–50,000 |
| roof · No photos of roof, but discoloration suggests potential issues | Major | $15,000–50,000 |
| Total estimated repair cost · 2 items | $30,000–100,000 |
Value-add ROI direction
- Both paint exterior — Enhances curb appeal and value ↑
- Both replace roof — Critical to the home's structural integrity and value ↑
- Both update HVAC system — Modernizes the system and improves comfort ↑
ⓘ Cost ranges are severity-bucket heuristics (US national rule-of-thumb). Get contractor quotes + a written scope before underwriting a rehab budget.
Schools (NCES district)
- District
- West Allis-West Milwaukee School District
- NCES district ID
- 5516260
- Math proficiency
- 17% ▼ -16.00%
- Reading proficiency
- 26% ▼ -12.00%
- Median HH income
- $45,620
- Composite
- 18.71/100
- National rank
- #8881
- State rank
- #328 of 342 in WI
Livability — West Allis
- Score
- 79/100
- State rank
- #69
- US rank
- #1958
Category grades
Schools grade is shown separately in the Schools card above.
Census & demographics
- Census place
- West Allis, WI
- County
- Milwaukee County · 926,379 people
- City population
- 57,365
- Metro
- Milwaukee-Waukesha, WI
- Population (ZIP)
- 22,885
- Household income
- $73,321
- Rent vs Own
- Severe rent burden
- 905.0
Population outlook (Milwaukee County) Hauer SSP2
- Today (2025)
- 995,758 people
- By 2030
- 1,009,124 · +1.3%
- By 2040
- 1,028,128 · +3.3%
- By 2050
- 1,040,066 · +4.4%
- By 2075
- 1,057,849 · +6.2%
- By 2100
- 1,039,774 · +4.4%
Race, ethnicity, and origin ACS 2023
- Neighborhood character
- Predominantly White (72%)
- Race & ethnicity
- White 72% Hispanic / Latino 12% Two or more races 11% Black 5% Asian 4%
- Hispanic origin (detail)
- Mexican 7% Puerto Rican 3%
- Common ancestry
- Romanian 15% Lithuanian 3% Italian 2%
- Foreign-born
- 5% · Canada
- Languages at home
- 88% English-only · Spanish 6% Other Asian/Pacific 2% Other Indo-European 1%
Political lean MEDSL · Milwaukee
- 2024 margin
- Solid D (+38.5) · D 68.3% · R 29.8% · Other 1.8%
- 2008→2024 swing
- +2.7pp toward D · 2008: 35.9pp · 2024: 38.5pp
- All cycles
- 2024: D+38.5 2020: D+39.9 2016: D+37.5 2012: D+34.6 2008: D+35.9
Not yet ingested
- Civics
- —
Market trends
- HPI YoY
- ▼ -103.81%
- Current HPI
- 251.8597
- Rent YoY
- —
- Metro
- Milwaukee-Waukesha, WI
- State GDP YoY
- ▲ 2.10%
- F500 in state
- 20
Industry mix (Fortune 500 HQ in WI)
| Industry | F500 HQs | Revenue |
|---|---|---|
| Industrial Machinery | 4 | $23B |
|
||
| Industrial Technology | 2 | $36B |
|
||
| Insurance | 1 | $36B |
|
||
| Professional Services | 1 | $19B |
|
||
| Utilities | 1 | $9B |
|
||
| Consumer Goods | 1 | $3B |
|
||
Price history
1 event — show timeline
- 2026-05-20 Listed $674,900 METROMLS
Cash-flow waterfall
monthlySold comps — $/sqft
last 12 mo · ≤1 miLoading sold comps…