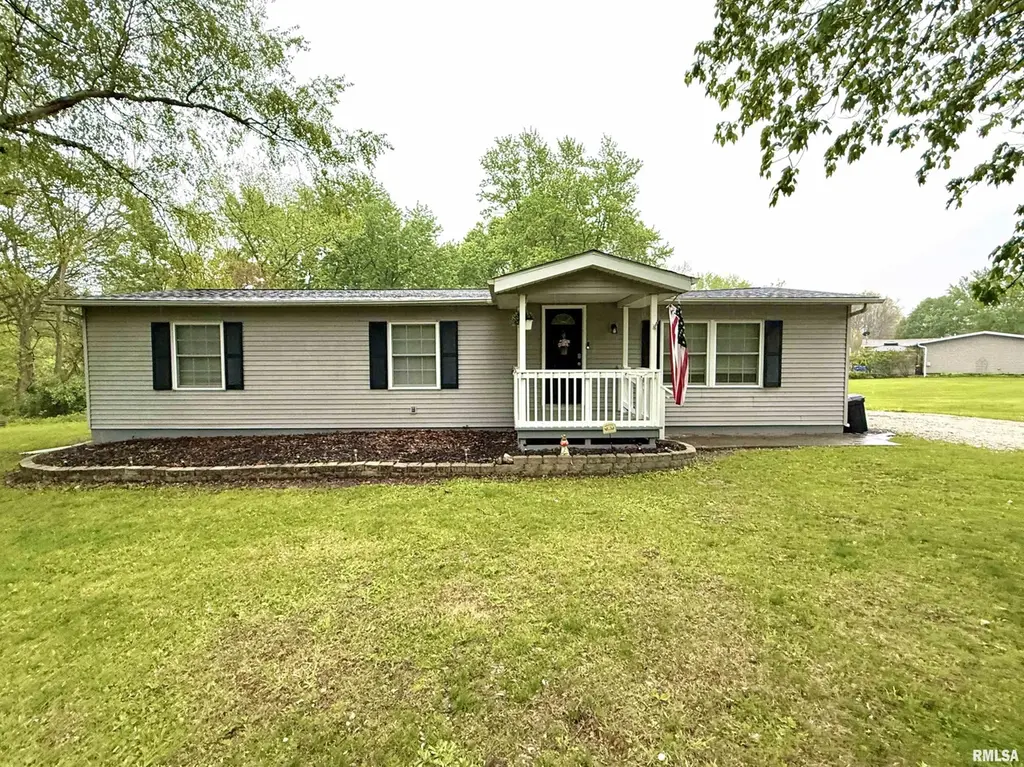
481 Greenbriar Ct
Oak Run, IL 61428
$175,000D-
3 bd · 2.0 ba ·
1,473 sqft ·
Built 1975
· SingleFamily
· Active
· 54 DOM
Cashflow @ list (25.0% down · 7.5%)
Estimated rent
$1,097/mo
Mortgage (P&I)
−$918
Tax + insurance
−$411
HOA
−$45
Vac / Maint / Mgmt
−$230
Net cashflow
$-507/mo
Annual
$-6,087/yr
Cap rate
2.81%
Cash-on-cash
-12.42%
DSCR
0.45
1% rule
0.63%
Cash to close
$49,000
Investor read
- This is a 3-bed/2.0-bath single-family listed at $175k.
- At list price, monthly cash flow is $-507 ($-6k/yr) — negative.
- To cash-flow at today's rent, offer at most $85k (51.2% below list).
- To meet the 1% rule (rent ≥ 1% of price), the offer needs to be $110k (37.3% below list).
- It's been on market 54 days — a 3% lower offer ($170k) is reasonable based on typical stale-listing flexibility.
- Recommended offer: $85k (51.2% below list) — sets the bar for cash-flow.
- In year one you build about $10k of equity ($1k loan paydown + $9k appreciation (5.0% local appreciation)).
- Location reads 66/100 on livability (#556 in IL) — a middle-class / working-renter tenant base. Strengths: crime A+, employment A+, housing A+; Watch: amenities F, commute F, health & safety F.
- Williamsfield CUSD 210 (rural): math 40% / reading 50% proficiency, ranked #225 of 919 in IL (top 24%) — families likely to look elsewhere, expect single-tenant / working-renter base with shorter leases.
- Zoned schools: Williamsfield High School (math 10% / reading 30%, grade F, #357 of 693 statewide, top 54%, 96 students, 0% FRL) — zoned schools average 0% FRL vs 30% district-wide (30 pts lower); this property's tenant base skews higher-income than the district average.
- Zoned-school proficiency averages 20% at this address vs 45% district-wide (-25 pts) — the specific schools serving this property underperform the Williamsfield CUSD 210 average; the district grade overstates school quality for this exact location.
- Market conditions: 45 active listings in the ZIP.
- Knox County population projected at -19% by 2050 — secular population decline; favor cash flow + early exit over multi-decade hold.
- 6 sale attempts since 3y ago with the ask held roughly flat each time — persistent listings suggest the price (not the market) is what's stuck; bring a comps-based counter.
- By year 4, paydown + projected appreciation supports a ~$33k cash-out refi (75% LTV) — recoverable capital for the next deal without selling this one.
Questions for listing agent
- What do current leases actually rent for vs. the listed asking? Can we see a recent rent roll and the last 12 months of T-12 income?
- It's been on market 54 days. Have you received any prior offers? Is the seller open to a 51% concession, seller financing, or rate buy-down credit?
- Built in 1975 — when were the roof, HVAC, electrical panel, plumbing, and water heater last replaced?
- What does the HOA fee cover, when was the last increase, and are there any pending special assessments or reserve-fund shortfalls?
- Is there a deadline driving the sale (1031 exchange, divorce, estate, relocation)? That informs how much negotiation room exists.
- The area grade is low — what's the realistic commute time and amenity access for the typical tenant pool here? Any planned neighborhood developments (good or bad) we should know about?
- What's the average days-on-market for RENTAL listings here right now (not sales)? A rising rental-DOM trend means longer vacancies and softer asking-rent achievability than the comps imply.
- What's the recent tenant-quality profile in this submarket — average credit score on applications, eviction rate, late-payment / NSF rate, and stable-employment percentage? A property-management company in the area should have these aggregated.
CashFlowRE · CFR-FWCFJAB7M58GKA
· Data 4 h ago
cashflowre.app · 2026-05-29